
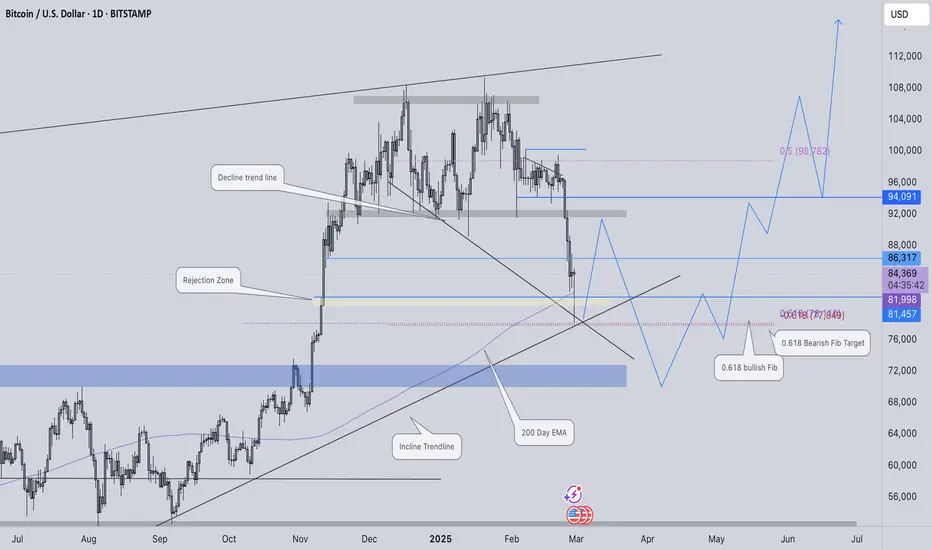
Over the past seven days, Bitcoin experienced a significant decline, dropping 2,440 pips before finding support around the 78,261 level. This area acted as a key zone of interest due to multiple technical confluences aligning, ultimately halting further downside movement. As a result, we are now witnessing a reaction at this level.
Looking ahead, I anticipate two potential scenarios. Bitcoin could revisit this support level, forming a double-bottom structure before initiating an upward push toward 91,500. Alternatively, it may first rally toward 91,500 before facing a rejection, leading to a corrective move down to approximately 71,500. If this pullback materializes and establishes a strong base, I expect Bitcoin to gain bullish momentum, eventually setting a new all-time high in the coming months.
Daily Chart Total Crypto Cap
There were multiple confluences to see an reaction at 2.6T.

Looking ahead, I anticipate two potential scenarios. Bitcoin could revisit this support level, forming a double-bottom structure before initiating an upward push toward 91,500. Alternatively, it may first rally toward 91,500 before facing a rejection, leading to a corrective move down to approximately 71,500. If this pullback materializes and establishes a strong base, I expect Bitcoin to gain bullish momentum, eventually setting a new all-time high in the coming months.
Daily Chart Total Crypto Cap
There were multiple confluences to see an reaction at 2.6T.

Thông báo miễn trừ trách nhiệm
Thông tin và các ấn phẩm này không nhằm mục đích, và không cấu thành, lời khuyên hoặc khuyến nghị về tài chính, đầu tư, giao dịch hay các loại khác do TradingView cung cấp hoặc xác nhận. Đọc thêm tại Điều khoản Sử dụng.
Thông báo miễn trừ trách nhiệm
Thông tin và các ấn phẩm này không nhằm mục đích, và không cấu thành, lời khuyên hoặc khuyến nghị về tài chính, đầu tư, giao dịch hay các loại khác do TradingView cung cấp hoặc xác nhận. Đọc thêm tại Điều khoản Sử dụng.