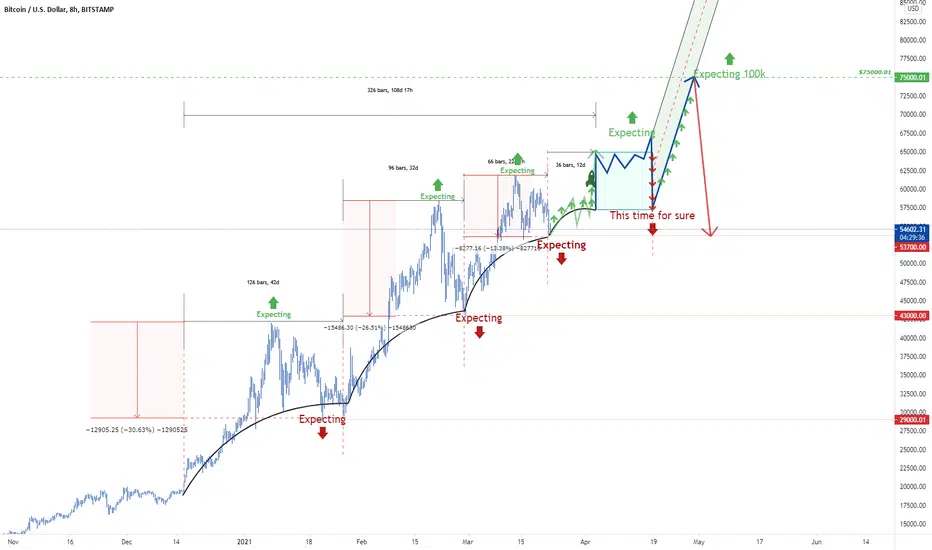
This is not a new idea or concept but it is something that should be visualized and prepared for. I'm not saying this is going to happen but I see this pattern unfolding on a few charts. All I can do is watch it live, manage risks, and look for confluence/confirmation patiently. I did reduce risk near the local and patiently await for some of my signals to come in. I always take the opportunity to increase BTC, even if its just converting profit in small orders when BTC respects my trends. I do expect a hefty correction at some point and this drop was marked on many of my charts as a pivot. However, I think it would be wrong to say the PA in this chart can't happen. It makes a lot of sense given that there seems to be a ton of bearish context after the latest drop.
Consider this a visual to keep in mind of how things evolve. Study liquidity, volume, and the seek peripheral data outside the default indicators and/or your routine system.
Neutral for today - Long overall
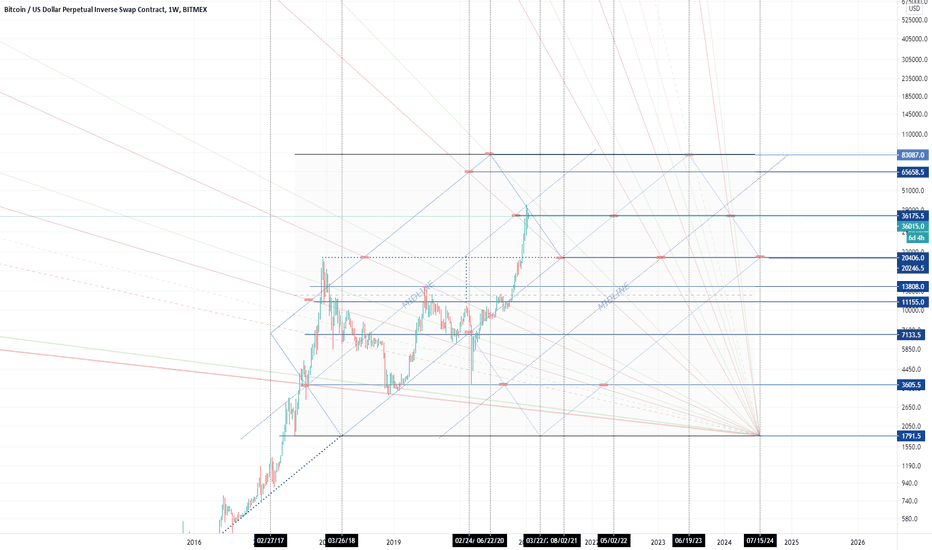

 BTCUSD
Consider this a visual to keep in mind of how things evolve. Study liquidity, volume, and the seek peripheral data outside the default indicators and/or your routine system.
Neutral for today - Long overall
BTCUSDGhi chú
Ghi chú
hitting the sideways chop on queue
Thông báo miễn trừ trách nhiệm
Thông tin và các ấn phẩm này không nhằm mục đích, và không cấu thành, lời khuyên hoặc khuyến nghị về tài chính, đầu tư, giao dịch hay các loại khác do TradingView cung cấp hoặc xác nhận. Đọc thêm tại Điều khoản Sử dụng.
Thông báo miễn trừ trách nhiệm
Thông tin và các ấn phẩm này không nhằm mục đích, và không cấu thành, lời khuyên hoặc khuyến nghị về tài chính, đầu tư, giao dịch hay các loại khác do TradingView cung cấp hoặc xác nhận. Đọc thêm tại Điều khoản Sử dụng.