
Technical Analysis and Outlook
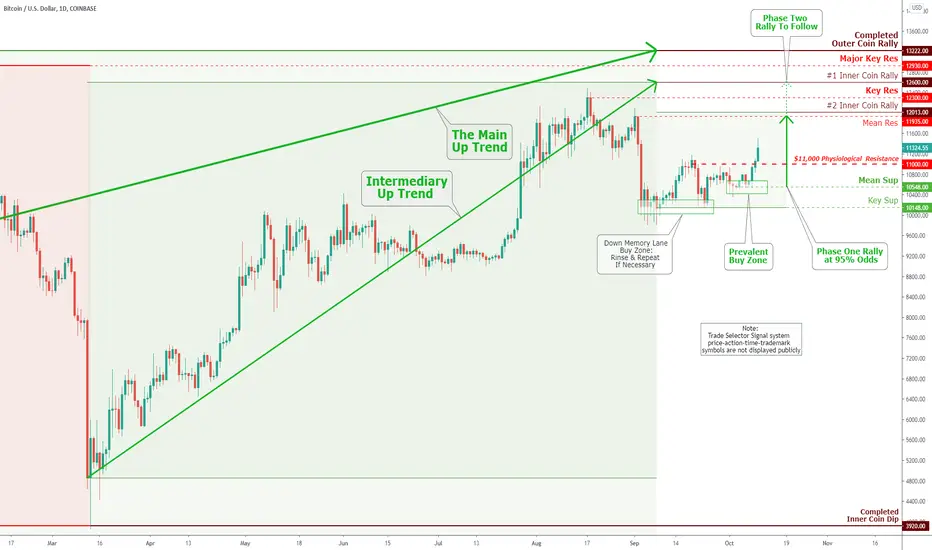
Bitcoin's price broke out of a powerful resistance of $11,000. As a result, the price is advancing to Mean Res $11,935 and #2 Inner Coin Rally marked at $12,013 - The trifling retest is expected, buy the ''Rinse and Repeat and ''Prevalent'' zones. Phase Two of the rally is very much to follow. To continue the rest story, see 'Weekly Market Review & Analysis For October 5, 2020, page.
Bitcoin's price broke out of a powerful resistance of $11,000. As a result, the price is advancing to Mean Res $11,935 and #2 Inner Coin Rally marked at $12,013 - The trifling retest is expected, buy the ''Rinse and Repeat and ''Prevalent'' zones. Phase Two of the rally is very much to follow. To continue the rest story, see 'Weekly Market Review & Analysis For October 5, 2020, page.

Thông báo miễn trừ trách nhiệm
Thông tin và các ấn phẩm này không nhằm mục đích, và không cấu thành, lời khuyên hoặc khuyến nghị về tài chính, đầu tư, giao dịch hay các loại khác do TradingView cung cấp hoặc xác nhận. Đọc thêm tại Điều khoản Sử dụng.
Thông báo miễn trừ trách nhiệm
Thông tin và các ấn phẩm này không nhằm mục đích, và không cấu thành, lời khuyên hoặc khuyến nghị về tài chính, đầu tư, giao dịch hay các loại khác do TradingView cung cấp hoặc xác nhận. Đọc thêm tại Điều khoản Sử dụng.