
please note: this is not a complete trading idea. This analysis is entirely based off historical data.
Many of us know that Bitcoin has seen several major correction throughout its lifespan. The last major correction took place back in late 2013, which resulted in a 90% correction from the top.
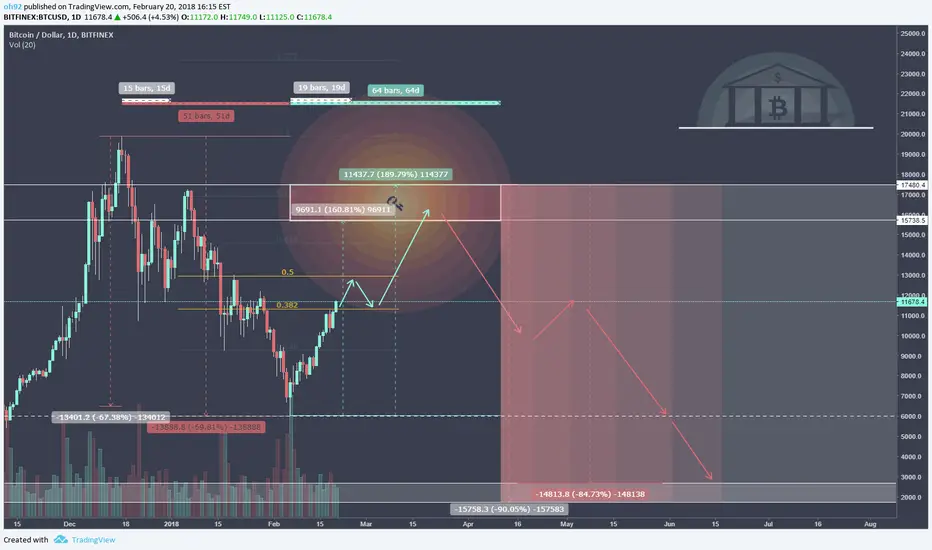
The chart above shows the percentages and ratios I collected from the 2013 crash that were then overlaid onto the recent Bitcoin chart.
Creating the possible route Bitcoin could take IF it follows the 2013 path.
The percentages & time frames that were collected are shown in grey. The red and green colors shows what I expect to happen based on the data.
The chart below shows the percentages collected for this experiment.

DISCLAIMER:
Please note I am only providing my own trading information for your benefit and insight to my trading techniques, you should do your own due diligence and not take this information as a trade signal.
Many of us know that Bitcoin has seen several major correction throughout its lifespan. The last major correction took place back in late 2013, which resulted in a 90% correction from the top.
The chart above shows the percentages and ratios I collected from the 2013 crash that were then overlaid onto the recent Bitcoin chart.
Creating the possible route Bitcoin could take IF it follows the 2013 path.
The percentages & time frames that were collected are shown in grey. The red and green colors shows what I expect to happen based on the data.
The chart below shows the percentages collected for this experiment.
DISCLAIMER:
Please note I am only providing my own trading information for your benefit and insight to my trading techniques, you should do your own due diligence and not take this information as a trade signal.

Creator of DepthHouse Indicators on TradingView!
↣ depthhouse.com/
↣ depthhouse.com/
Bài đăng liên quan
Thông báo miễn trừ trách nhiệm
Thông tin và các ấn phẩm này không nhằm mục đích, và không cấu thành, lời khuyên hoặc khuyến nghị về tài chính, đầu tư, giao dịch hay các loại khác do TradingView cung cấp hoặc xác nhận. Đọc thêm tại Điều khoản Sử dụng.
Creator of DepthHouse Indicators on TradingView!
↣ depthhouse.com/
↣ depthhouse.com/
Bài đăng liên quan
Thông báo miễn trừ trách nhiệm
Thông tin và các ấn phẩm này không nhằm mục đích, và không cấu thành, lời khuyên hoặc khuyến nghị về tài chính, đầu tư, giao dịch hay các loại khác do TradingView cung cấp hoặc xác nhận. Đọc thêm tại Điều khoản Sử dụng.