
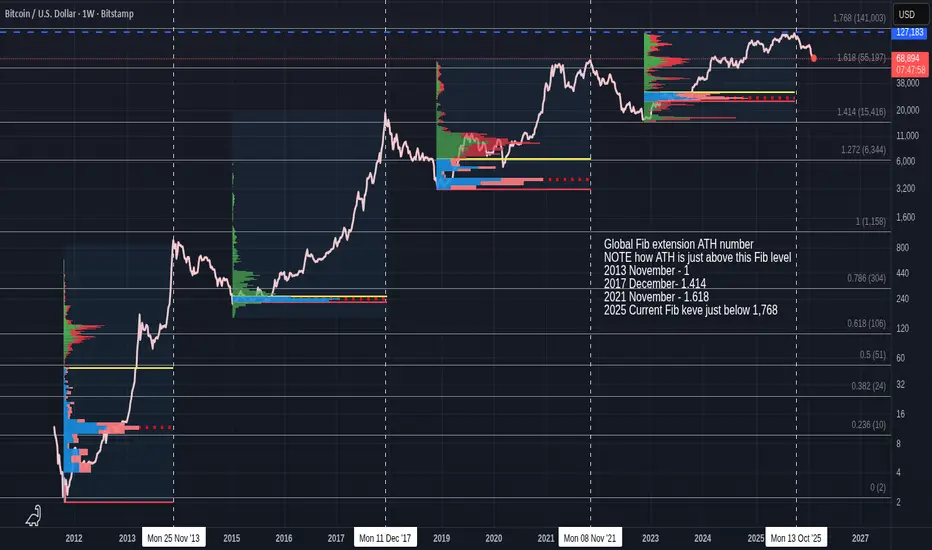
The Main Chart is using Fixed Range Volume Profiles.
These are based on the Low from the previous High, till the Next ATH, showing us the Volume profile for Each "Cycle"
OR, Where were people most interested in Buying Bitcoin in a cycle.
As we Look at each cycle Closer. you will also be seeing the Fixed VWAP.
Volume-Weighted Average Price (VWAP) is a technical analysis indicator that calculates the average price a security has traded at throughout the day, weighted by trading volume. It provides a more accurate representation of true market activity than simple averages because it gives greater importance to prices at which larger volumes were traded.
I will start these Zooomed in charts from the 2015 cycle but it is interesting to see how the Volume was from the 2011 low. The was A Bitcoin for $2 !
You will see 2 Horizontal lines , Yellow and Red, This is the VALUE AREA Range....High ( Yellow ) and LOW ( Red )
This Vakue Area shows you were 70% of the trading took place in the Given Range selected ( Low to ATH ).
Value area in 2011 -> 2013 = 2 - 47 usd
Note how Tall this Range is in the chart and how it is mostly traded Low and then traders waited till the ATH was reached.
These people were probably the creators of Bitcoin, Friends and interested parties that were offered a cheap gamble on something that May be "Big value" one day.
I bought my first Bitcoins at $33 and Lost the address,,,,,,,,,,,,,,,,NO COMMENT ( I had seen a TV program talking about it and so spent £1000 at Mt Gox, thinking I could be Rich one day)
2015 to 2017 Profile
See the 2 Horizontal yellow lines....~This is the Value Area. ( I forgot to change lower line to Red)
See how much smaller this is compared to previous.
This shows that people KNEW where the Bottom was, When to Buy and then Wait.
The Value area this time was 2015 -> 2017 = 225 - 255
a $30 range !!!!
We can see a vastly reduced Volume of trading as Price rose.....Again, Showing people understanding what to do and WAITING>
Another thing to see here is those VWAP lines,,,the Yellow and Red
The Yellow is the VWAP and the others are Multiples of that....
I'll not go into details here but Note how that VWAP (yellow ) line progresses and PA hit it at the Bottom and marked the beginning of the Next Cycle.
2019 to 2021 Profile
Again, see the 2 Horizontal yellow lines, the Value Area.
2019 -> 2021 = 3419 - 6344 usd , this time, a $3000 usd range
See how Most of the trading was done AT THE BOTTOM, where that VWAP met the PA line.
See how the VMAP line Rose, with PA above it. It is generally considered bullish when PA is above VMAP.
We did see PA drop below the VWAP line in Late 2022 and this was certainly triggered by the FTX Scam coming to light.
This scared traders and we now see more and more Professional traders entering the Bitcoin world. But as we can see on the next Profile, the FTX problems Scared traders.
2023 - 2025 profile
See how much higher the Value Area is this time ? People did trade the Bottom, the Risk was high after the previous year of Companies collapsing etc.
The Value are this time was 24812 - 31093 usd. The Low was around 15K !
People were nervous, waited and entered slowly.
BUT what makes this So Very different is looking at the amount of trading Higher up. Confidence returned when the USA decided to NOT demonise Bitcoin
This is the ETF Arrival.........The Corporate arrival and maybe the Change of cycle dynamics.
And Look were that VWAP line is NOW......PA has bounced off it already............Was that the Bottom ?
But is this the End of one Cycle and the start of another ?
I am not sure yet.
For a start, PA usualy reaches ATH by reaching above the upper band of the VWAP ( 2nd Red line)
We have not done that yet.
What is also interesting to see is how the ATH's are All Just above the Next Fib Extension , except for the current ATH, Showing that, Maybe, this cycle is NOT over yet.
Global Fib extension ATH number
NOTE how ATH is just above this Fib level
2013 November - 1
2017 December- 1.414
2021 November - 1.618
2025 Current Fib keve just below 1,768 - Are we going to see a push over that line before Real Cycle Close?
Or have we entered a Super cycle ?
So, we do seem to have a change in the making............
Early reach down to VWAP line, so far, not even a -50% drop from ATH compared to the usual -80%
Not reaching above the next Fib extension
High trading Volume late in cycle
PA Not reaching above the 2nd line high on VWAP
And so much more.
Interesting days.............................
For me, We have reached A Bottom, Not THE Bottom and I am not to sure we will ever see a real Bottom agaain...We WILL see LOWS.....
But I think Cycle dynamics have changed and this is discussed in charts I have posted about the Fibonacci Arc that has rejected every ATH
Time Will tell

Nothing to be taken as Financial advice.
I will always say
"Only invest what you can afford to loose. When you are ready, take out your original investment. This way, it is only your profit that is at risk"
THAT is Financial advice
I will always say
"Only invest what you can afford to loose. When you are ready, take out your original investment. This way, it is only your profit that is at risk"
THAT is Financial advice
Thông báo miễn trừ trách nhiệm
Thông tin và các ấn phẩm này không nhằm mục đích, và không cấu thành, lời khuyên hoặc khuyến nghị về tài chính, đầu tư, giao dịch hay các loại khác do TradingView cung cấp hoặc xác nhận. Đọc thêm tại Điều khoản Sử dụng.
Nothing to be taken as Financial advice.
I will always say
"Only invest what you can afford to loose. When you are ready, take out your original investment. This way, it is only your profit that is at risk"
THAT is Financial advice
I will always say
"Only invest what you can afford to loose. When you are ready, take out your original investment. This way, it is only your profit that is at risk"
THAT is Financial advice
Thông báo miễn trừ trách nhiệm
Thông tin và các ấn phẩm này không nhằm mục đích, và không cấu thành, lời khuyên hoặc khuyến nghị về tài chính, đầu tư, giao dịch hay các loại khác do TradingView cung cấp hoặc xác nhận. Đọc thêm tại Điều khoản Sử dụng.