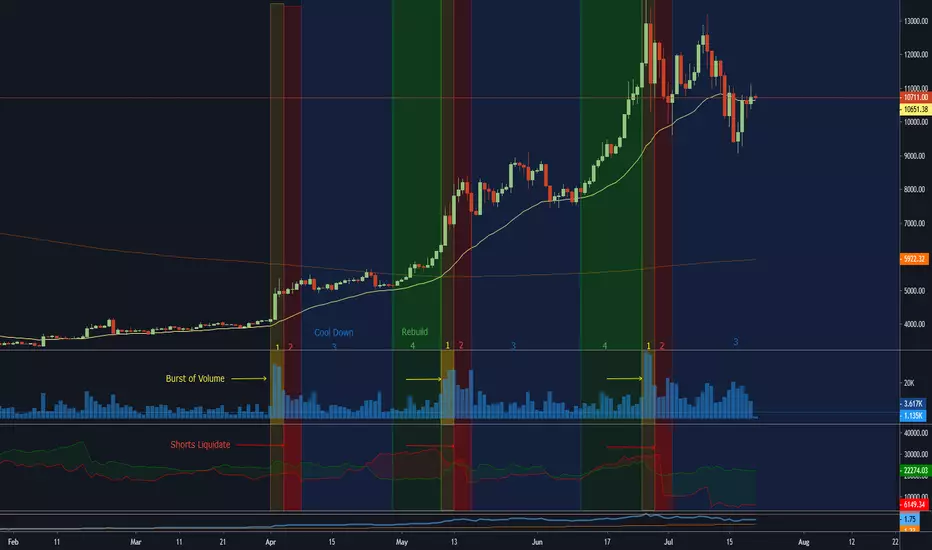
Recently noticed a pattern in the charts.
The third chart is a piece of pine script I wrote to help visualize BTCUSDSHORTS and BTCUSDLONGS.
A drop in open shorts has been preceded by large volume pushing the price higher, likely into many stops, continuing the rally.

As you can see, after the action has cooled down price, will move to the 30 day EMA before it picks up again. Except for this last time. Price plunged under the 30 day EMA before it snapped back to the EMA. Also, the amount of open shorts on Bitfinex is the lowest its been.

This leads me to believe the cool down period will last longer than the previous ones.
The third chart is a piece of pine script I wrote to help visualize
BTCUSDSHORTS and BTCUSDLONGS. A drop in open shorts has been preceded by large volume pushing the price higher, likely into many stops, continuing the rally.
As you can see, after the action has cooled down price, will move to the 30 day EMA before it picks up again. Except for this last time. Price plunged under the 30 day EMA before it snapped back to the EMA. Also, the amount of open shorts on Bitfinex is the lowest its been.
This leads me to believe the cool down period will last longer than the previous ones.

Thông báo miễn trừ trách nhiệm
Thông tin và các ấn phẩm này không nhằm mục đích, và không cấu thành, lời khuyên hoặc khuyến nghị về tài chính, đầu tư, giao dịch hay các loại khác do TradingView cung cấp hoặc xác nhận. Đọc thêm tại Điều khoản Sử dụng.
Thông báo miễn trừ trách nhiệm
Thông tin và các ấn phẩm này không nhằm mục đích, và không cấu thành, lời khuyên hoặc khuyến nghị về tài chính, đầu tư, giao dịch hay các loại khác do TradingView cung cấp hoặc xác nhận. Đọc thêm tại Điều khoản Sử dụng.