
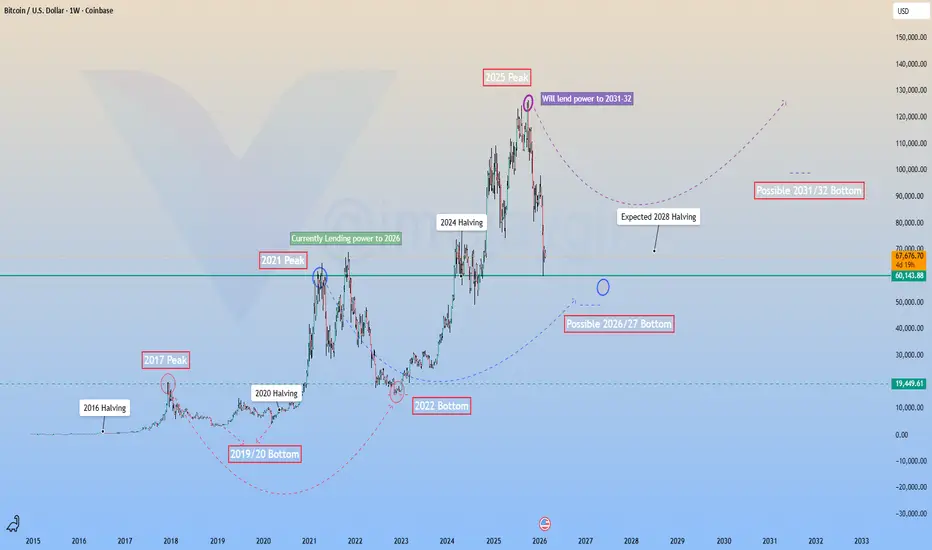
Analyzing BTC on the weekly timeframe gives a clear view of how it forms a bottom after making a new ATH and completing a cycle.
Starting from the 2017 cycle, we can observe that the previous cycle’s ATH tends to act as strong support for the next cycle’s bottom. The price may not hold the exact level, but it usually stays within a possible 20 percent deviation range.
I have plotted most of my findings on the chart. If you have any questions, drop them in the comments and I’ll be happy to discuss the concepts. If you follow a different theory, share it as well and let’s break it down together.
Starting from the 2017 cycle, we can observe that the previous cycle’s ATH tends to act as strong support for the next cycle’s bottom. The price may not hold the exact level, but it usually stays within a possible 20 percent deviation range.
I have plotted most of my findings on the chart. If you have any questions, drop them in the comments and I’ll be happy to discuss the concepts. If you follow a different theory, share it as well and let’s break it down together.

Thông báo miễn trừ trách nhiệm
Thông tin và các ấn phẩm này không nhằm mục đích, và không cấu thành, lời khuyên hoặc khuyến nghị về tài chính, đầu tư, giao dịch hay các loại khác do TradingView cung cấp hoặc xác nhận. Đọc thêm tại Điều khoản Sử dụng.
Thông báo miễn trừ trách nhiệm
Thông tin và các ấn phẩm này không nhằm mục đích, và không cấu thành, lời khuyên hoặc khuyến nghị về tài chính, đầu tư, giao dịch hay các loại khác do TradingView cung cấp hoặc xác nhận. Đọc thêm tại Điều khoản Sử dụng.