
BTC on the long-term chart is in a bullish pivot. See the image below.

The red lines are the resistance points that the crypto needs to overcome to reach the yellow lines (Targets).
On the medium-term chart, prices are also in an upward pivot. See image below.

Remember if. The red lines are resistance points.
In the short term I see a rise in drift. What a thing, right?

The bulls had better start acting, and push prices hard above 44.9K.
At the moment, the limiter is the 42K region. We had an accumulation that projects highs up to the mentioned range (42K).

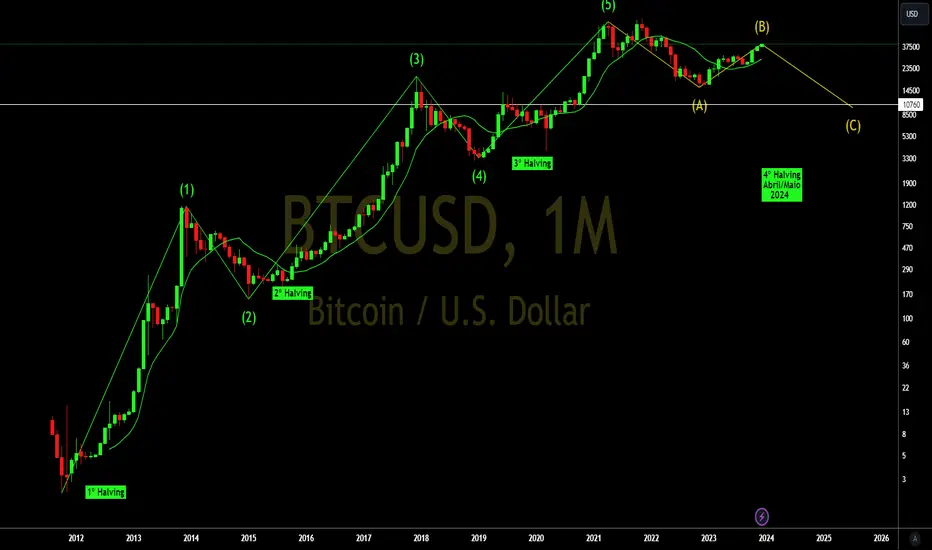
Below is an updated graphic image of the 12345ABC Elliott pattern! Don't get stuck in the past!

Do your analysis and good business.
Be aware, if you buy, use stop loss.
See other graphical analyzes below.
The red lines are the resistance points that the crypto needs to overcome to reach the yellow lines (Targets).
On the medium-term chart, prices are also in an upward pivot. See image below.
Remember if. The red lines are resistance points.
In the short term I see a rise in drift. What a thing, right?
The bulls had better start acting, and push prices hard above 44.9K.
At the moment, the limiter is the 42K region. We had an accumulation that projects highs up to the mentioned range (42K).
Below is an updated graphic image of the 12345ABC Elliott pattern! Don't get stuck in the past!
Do your analysis and good business.
Be aware, if you buy, use stop loss.
See other graphical analyzes below.

Bài đăng liên quan
Thông báo miễn trừ trách nhiệm
Thông tin và các ấn phẩm này không nhằm mục đích, và không cấu thành, lời khuyên hoặc khuyến nghị về tài chính, đầu tư, giao dịch hay các loại khác do TradingView cung cấp hoặc xác nhận. Đọc thêm tại Điều khoản Sử dụng.
Bài đăng liên quan
Thông báo miễn trừ trách nhiệm
Thông tin và các ấn phẩm này không nhằm mục đích, và không cấu thành, lời khuyên hoặc khuyến nghị về tài chính, đầu tư, giao dịch hay các loại khác do TradingView cung cấp hoặc xác nhận. Đọc thêm tại Điều khoản Sử dụng.