
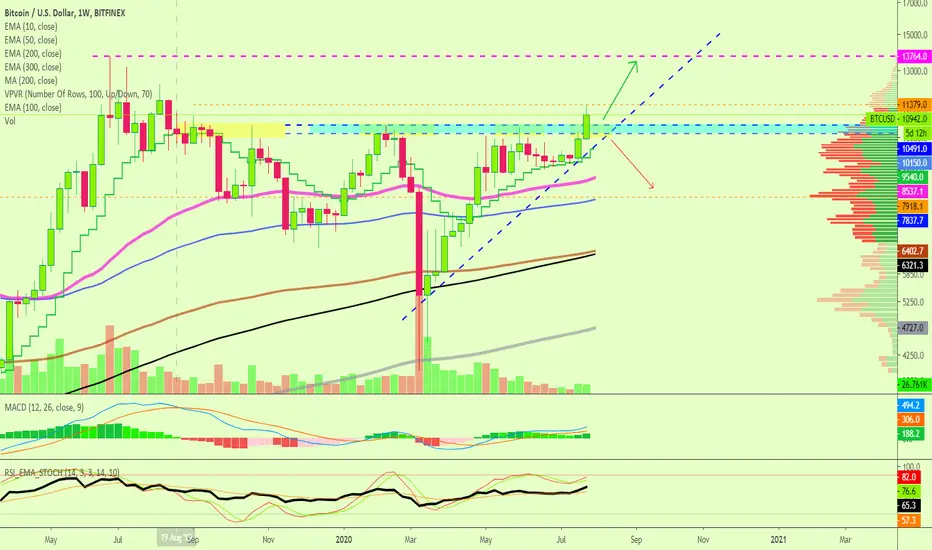
Here we have an updated version of the weekly (W) chart for Bitcoin (BTCUSD) since the $10400/$10500 barrier has been taken out.
One important note before we get started.
This week is brand new and we are looking at the weekly chart.
The price for Bitcoin can change and reverse by end of week so we need candle closure for confirmation...
The trading volume is still low... Let's get started.
With that said, this is very likely a real move as we can appreciate a very strong RSI.
A fake move would not happen on such high numbers for the RSI.
Knowing Bitcoin and how it likes to amaze... We are likely to continue seeing additional bullish action.
Gold going up can also be used as a positive signal for Bitcoin.
More volume is needed and will hopefully come this week.
This is the weekly chart for Bitcoin updated.
This is Alan Masters.
Thanks a lot for your support.
Namaste.
One important note before we get started.
This week is brand new and we are looking at the weekly chart.
The price for Bitcoin can change and reverse by end of week so we need candle closure for confirmation...
The trading volume is still low... Let's get started.
With that said, this is very likely a real move as we can appreciate a very strong RSI.
A fake move would not happen on such high numbers for the RSI.
Knowing Bitcoin and how it likes to amaze... We are likely to continue seeing additional bullish action.
Gold going up can also be used as a positive signal for Bitcoin.
- Bitcoin hit its highest level since August 2019... Great news.
- The technicals/signals on the Bitcoin chart are strongly bullish.
- The MACD shows plenty of room still left available for growth, same for the RSI.
- A bullish Bitcoin is good for the altcoins market even if short-term we see/experience strong corrections when Bitcoin grows.
More volume is needed and will hopefully come this week.
This is the weekly chart for Bitcoin updated.
This is Alan Masters.
Thanks a lot for your support.
Namaste.
Ghi chú
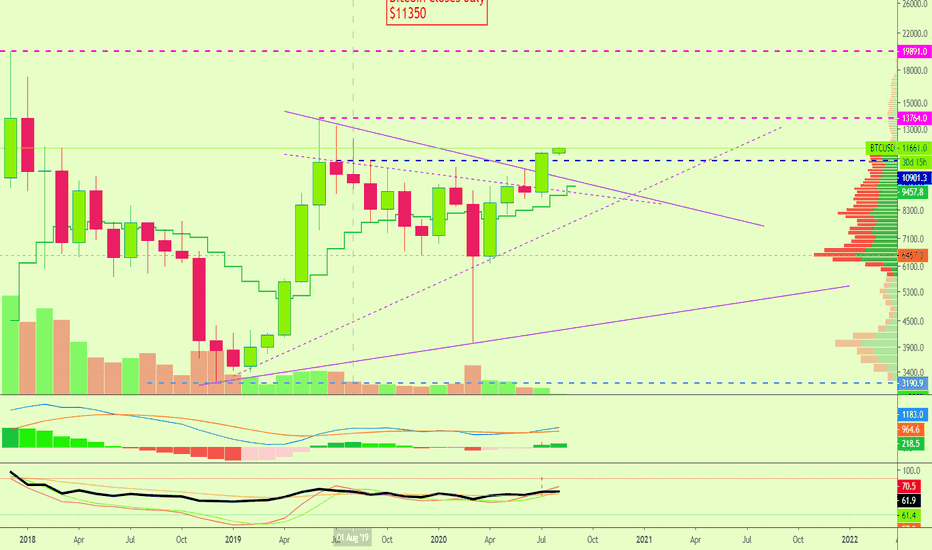
Our monthly chart for Bitcoin has been updated...Bitcoin Monthly Closes At $11350, Next Target Updated At... (Altcoins Market Update)

💯 Trading signals (results)
— Late 2026👇
t.me/masteranandatrades/9279
🔥 10-25X Leverage
—Trade-numbers:
t.me/masteranandatrades/9271
✅ PREMIUM &Content
—One-Time Payment
t.me/lamatrades/4 (🔝 since 2017)
— Late 2026👇
t.me/masteranandatrades/9279
🔥 10-25X Leverage
—Trade-numbers:
t.me/masteranandatrades/9271
✅ PREMIUM &Content
—One-Time Payment
t.me/lamatrades/4 (🔝 since 2017)
Bài đăng liên quan
Thông báo miễn trừ trách nhiệm
Thông tin và các ấn phẩm này không nhằm mục đích, và không cấu thành, lời khuyên hoặc khuyến nghị về tài chính, đầu tư, giao dịch hay các loại khác do TradingView cung cấp hoặc xác nhận. Đọc thêm tại Điều khoản Sử dụng.