
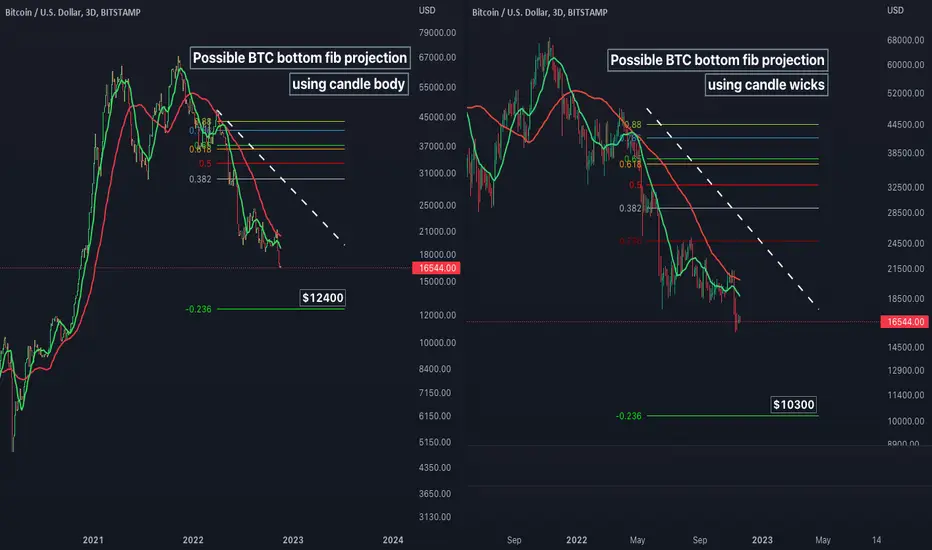
BTC price chart analysis on the 3Day time frame (Heikin-Ashi candles, wicks removed, log).
BTC appears to be completing a 5 wave down:
-I could go long layering in, if the price hits near these levels of -.23 fibonacci extension.
IMPORTANT
If the 3day 13 SMA crosses the 48 SMA up and both turn up, I default back to trend analysis
I could also add other indicators such as custom buy sell signals and or MACD , Stochastic , RSI , to assist my decisions but this is a simple projection.
None of this should be interpreted as financial advice, I am not a professional or certified financial adviser! all charts, and or analysis' are my personal opinions and observations only!
BTC appears to be completing a 5 wave down:
-I could go long layering in, if the price hits near these levels of -.23 fibonacci extension.
IMPORTANT
If the 3day 13 SMA crosses the 48 SMA up and both turn up, I default back to trend analysis
I could also add other indicators such as custom buy sell signals and or MACD , Stochastic , RSI , to assist my decisions but this is a simple projection.
None of this should be interpreted as financial advice, I am not a professional or certified financial adviser! all charts, and or analysis' are my personal opinions and observations only!

Thông báo miễn trừ trách nhiệm
Thông tin và các ấn phẩm này không nhằm mục đích, và không cấu thành, lời khuyên hoặc khuyến nghị về tài chính, đầu tư, giao dịch hay các loại khác do TradingView cung cấp hoặc xác nhận. Đọc thêm tại Điều khoản Sử dụng.
Thông báo miễn trừ trách nhiệm
Thông tin và các ấn phẩm này không nhằm mục đích, và không cấu thành, lời khuyên hoặc khuyến nghị về tài chính, đầu tư, giao dịch hay các loại khác do TradingView cung cấp hoặc xác nhận. Đọc thêm tại Điều khoản Sử dụng.