
Hello, traders!🧨
We continue to watch the crash unfold in real time⚰️
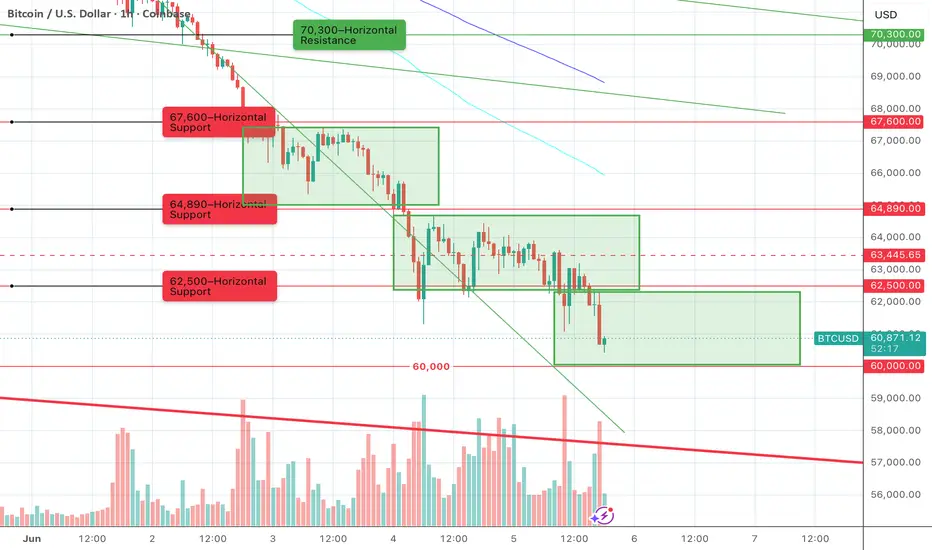
The decline is developing in waves, following almost the exact same pattern each time: a key horizontal support breaks, price attempts to move into a sideways range, fails, and then another leg down follows.
❗️First, the 67,600 level was lost. After that, price attempted to establish a range between 64,890 and 67,600. The attempt failed, and the market moved lower.
❗️Over the past 24 hours, the same scenario repeated once again. The 64,890 level was broken, followed by an attempt to form a range between 62,500 and 64,890. That attempt also failed, leading to another wave of selling.
✅✅✅The next potential bounce and attempt to move into a sideways range could occur around the 60,000 level.
For now, the market structure remains unchanged — every local range ends with a downside breakout and a continuation of the downtrend.
Peace🌄
We continue to watch the crash unfold in real time⚰️
The decline is developing in waves, following almost the exact same pattern each time: a key horizontal support breaks, price attempts to move into a sideways range, fails, and then another leg down follows.
❗️First, the 67,600 level was lost. After that, price attempted to establish a range between 64,890 and 67,600. The attempt failed, and the market moved lower.
❗️Over the past 24 hours, the same scenario repeated once again. The 64,890 level was broken, followed by an attempt to form a range between 62,500 and 64,890. That attempt also failed, leading to another wave of selling.
✅✅✅The next potential bounce and attempt to move into a sideways range could occur around the 60,000 level.
For now, the market structure remains unchanged — every local range ends with a downside breakout and a continuation of the downtrend.
Peace🌄

Thông báo miễn trừ trách nhiệm
Thông tin và các ấn phẩm này không nhằm mục đích, và không cấu thành, lời khuyên hoặc khuyến nghị về tài chính, đầu tư, giao dịch hay các loại khác do TradingView cung cấp hoặc xác nhận. Đọc thêm tại Điều khoản Sử dụng.
Thông báo miễn trừ trách nhiệm
Thông tin và các ấn phẩm này không nhằm mục đích, và không cấu thành, lời khuyên hoặc khuyến nghị về tài chính, đầu tư, giao dịch hay các loại khác do TradingView cung cấp hoặc xác nhận. Đọc thêm tại Điều khoản Sử dụng.