
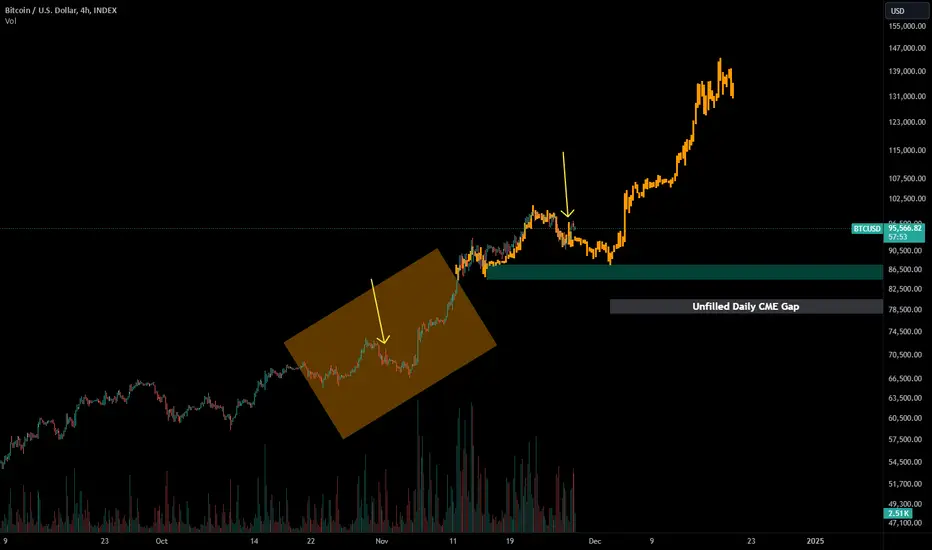
Possible repeating pattern to the leg up from 65 to 98k. Yellow arrow shows where we are in the same setup that is highlighted by the orange rectangle.
If this is true, we'd see something like a drop from here to mid-to-low 80k range before finding enough buyers for the push above 100k.
Long-term long, short-term short.
Reminder that there is a daily CME gap yet unfilled below this area however, around 78 to 80.7k:

If this is true, we'd see something like a drop from here to mid-to-low 80k range before finding enough buyers for the push above 100k.
Long-term long, short-term short.
Reminder that there is a daily CME gap yet unfilled below this area however, around 78 to 80.7k:

Thông báo miễn trừ trách nhiệm
Thông tin và các ấn phẩm này không nhằm mục đích, và không cấu thành, lời khuyên hoặc khuyến nghị về tài chính, đầu tư, giao dịch hay các loại khác do TradingView cung cấp hoặc xác nhận. Đọc thêm tại Điều khoản Sử dụng.
Thông báo miễn trừ trách nhiệm
Thông tin và các ấn phẩm này không nhằm mục đích, và không cấu thành, lời khuyên hoặc khuyến nghị về tài chính, đầu tư, giao dịch hay các loại khác do TradingView cung cấp hoặc xác nhận. Đọc thêm tại Điều khoản Sử dụng.