
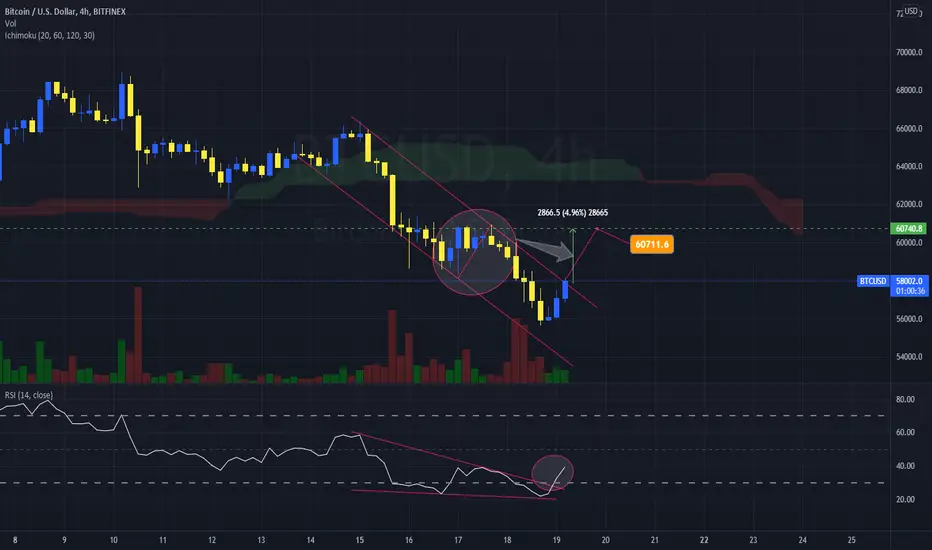
Hello friends, today I am reviewing the 4H chart for Bitcoin (BTC) on a linear scale.
In the chart I noted:
1) The price has been moving in a downward channel over the past days.
2) Currently, the price is attempting to break out of the channel with a measured move of about 5% to $60,711, where there prior period resistance.
3) The RSI has also broken out of a descending wedge it was forming. It is out of the oversold area now.
4) The Ichimoku Cloud is above us and though in the short term, price may go higher, the Ichimoku Cloud is showing that we may be headed further lower again.
What are your opinions on this?
If you enjoy my ideas, feel free to like it and drop in a comment. I love reading your comments below.
Disclosure: This is just my opinion and not any type of financial advice. I enjoy charting and discussing technical analysis. Don't trade based on my advice. Do your own research! #cryptopickk

Bài đăng liên quan
Thông báo miễn trừ trách nhiệm
Thông tin và các ấn phẩm này không nhằm mục đích, và không cấu thành, lời khuyên hoặc khuyến nghị về tài chính, đầu tư, giao dịch hay các loại khác do TradingView cung cấp hoặc xác nhận. Đọc thêm tại Điều khoản Sử dụng.
Bài đăng liên quan
Thông báo miễn trừ trách nhiệm
Thông tin và các ấn phẩm này không nhằm mục đích, và không cấu thành, lời khuyên hoặc khuyến nghị về tài chính, đầu tư, giao dịch hay các loại khác do TradingView cung cấp hoặc xác nhận. Đọc thêm tại Điều khoản Sử dụng.