
₿ BTC/USD – Bearish Continuation After Breakdown
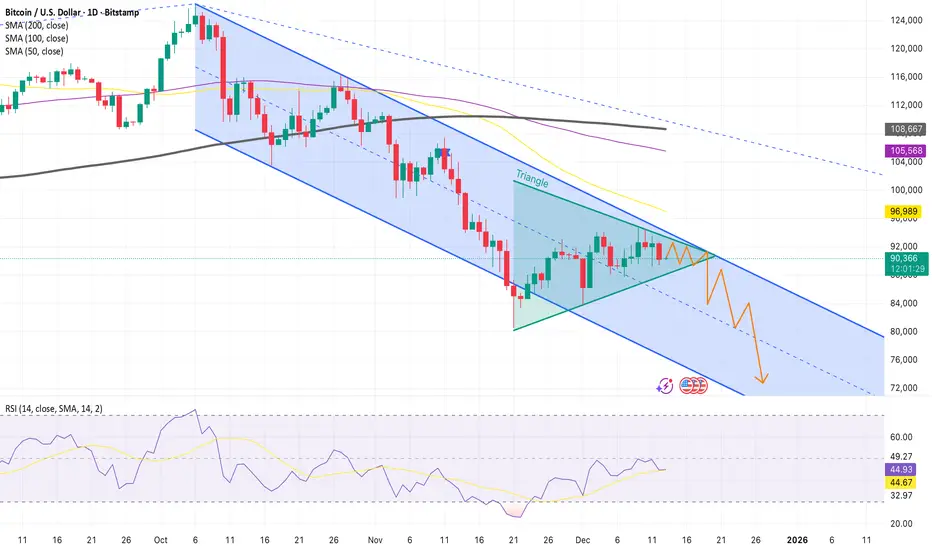
Bitcoin remains in a clear downtrend, trading inside a well-defined descending channel. The market structure continues to print lower highs and lower lows, confirming that sellers are still in control.
⸻
🔹 Descending Channel
• Price has been respecting the upper and lower bounds of the channel very cleanly.
• Multiple rejections from the channel top confirm strong overhead resistance.
• As long as BTC stays inside this channel, the trend bias remains bearish.
⸻
🔹 Triangle Consolidation
• BTC is now forming a triangle inside the downtrend, indicating consolidation, not reversal.
• This type of triangle is typically a bearish continuation pattern.
• A breakdown below the triangle support would likely trigger the next impulsive leg down.
⸻
🔹 Moving Averages
• Price is trading below the 50, 100, and 200 SMAs, reinforcing bearish pressure.
• The 200 SMA (~108.6K) remains far above price and acts as major resistance.
• Any bounce into these averages is likely to be sold into.
⸻
🔹 RSI Confirmation
• RSI is below 50, showing weak momentum and lack of bullish strength.
• No bullish divergence is present, supporting the continuation downside scenario.
⸻
🔹 Key Levels
• Resistance: 96K → 105K → 108K
• Support: 88K → 84K → 80K → low-70Ks (channel extension)
A confirmed breakdown could open the door toward the mid- to low-70K area.
⸻
🔹 Conclusion
This looks like bearish consolidation before continuation, not accumulation.
Until BTC breaks above the channel and key moving averages, the path of least resistance remains down.
⸻
🧠 “In a downtrend, consolidation is usually a pause — not a bottom.”
📜 Disclaimer: This is general information only and not financial advice.

Thông báo miễn trừ trách nhiệm
Thông tin và các ấn phẩm này không nhằm mục đích, và không cấu thành, lời khuyên hoặc khuyến nghị về tài chính, đầu tư, giao dịch hay các loại khác do TradingView cung cấp hoặc xác nhận. Đọc thêm tại Điều khoản Sử dụng.
Thông báo miễn trừ trách nhiệm
Thông tin và các ấn phẩm này không nhằm mục đích, và không cấu thành, lời khuyên hoặc khuyến nghị về tài chính, đầu tư, giao dịch hay các loại khác do TradingView cung cấp hoặc xác nhận. Đọc thêm tại Điều khoản Sử dụng.