
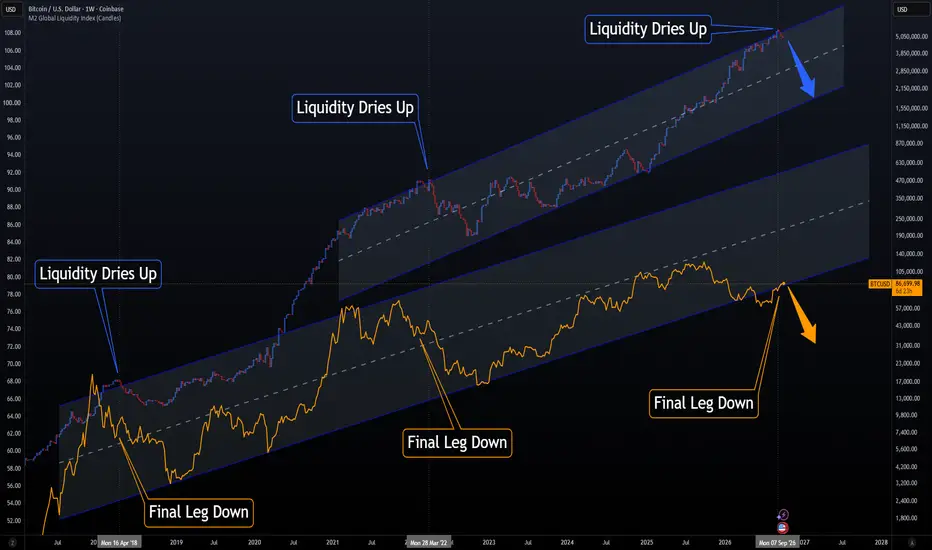
The blue and red candles on the top are global liquidity, while the orange line on the bottom is Bitcoin (BTC).
The idea behind this chart is pretty simple: when liquidity expands, risk assets like Bitcoin tend to benefit. When liquidity begins to contract, that support starts to disappear and capital can begin rotating away from risk.
The historical examples on the chart show periods where liquidity began to roll over first, followed by a final leg down in Bitcoin. My current thesis is that we may be seeing a similar setup developing again.
Right now, global liquidity appears to be approaching an area where I believe it could begin rolling over. If that happens, Bitcoin may not react immediately, but BTC is a liquidity-sensitive risk asset, so a continued contraction in liquidity could eventually put more pressure on price.
Liquidity rolls over → risk appetite weakens → BTC comes under pressure.
I also have separate work in the credit markets that is beginning to support the same broader risk-off thesis. I’ll go deeper into that side of the model in future analysis.
Important: The arrows on the chart are not exact price targets or exact timing projections. They are simply there to illustrate the directional move I’m watching if liquidity continues to weaken. The historical examples are meant to show the relationship and sequence, not suggest that every cycle will play out exactly the same way.
And sorry for the spacing on the chart — this is the best I could get the M2 indicator to line up. It’s a little difficult to adjust cleanly.
For now, the message is simple:
Follow the money.
The idea behind this chart is pretty simple: when liquidity expands, risk assets like Bitcoin tend to benefit. When liquidity begins to contract, that support starts to disappear and capital can begin rotating away from risk.
The historical examples on the chart show periods where liquidity began to roll over first, followed by a final leg down in Bitcoin. My current thesis is that we may be seeing a similar setup developing again.
Right now, global liquidity appears to be approaching an area where I believe it could begin rolling over. If that happens, Bitcoin may not react immediately, but BTC is a liquidity-sensitive risk asset, so a continued contraction in liquidity could eventually put more pressure on price.
Liquidity rolls over → risk appetite weakens → BTC comes under pressure.
I also have separate work in the credit markets that is beginning to support the same broader risk-off thesis. I’ll go deeper into that side of the model in future analysis.
Important: The arrows on the chart are not exact price targets or exact timing projections. They are simply there to illustrate the directional move I’m watching if liquidity continues to weaken. The historical examples are meant to show the relationship and sequence, not suggest that every cycle will play out exactly the same way.
And sorry for the spacing on the chart — this is the best I could get the M2 indicator to line up. It’s a little difficult to adjust cleanly.
For now, the message is simple:
Follow the money.

Thông báo miễn trừ trách nhiệm
Thông tin và các ấn phẩm này không nhằm mục đích, và không cấu thành, lời khuyên hoặc khuyến nghị về tài chính, đầu tư, giao dịch hay các loại khác do TradingView cung cấp hoặc xác nhận. Đọc thêm tại Điều khoản Sử dụng.
Thông báo miễn trừ trách nhiệm
Thông tin và các ấn phẩm này không nhằm mục đích, và không cấu thành, lời khuyên hoặc khuyến nghị về tài chính, đầu tư, giao dịch hay các loại khác do TradingView cung cấp hoặc xác nhận. Đọc thêm tại Điều khoản Sử dụng.