
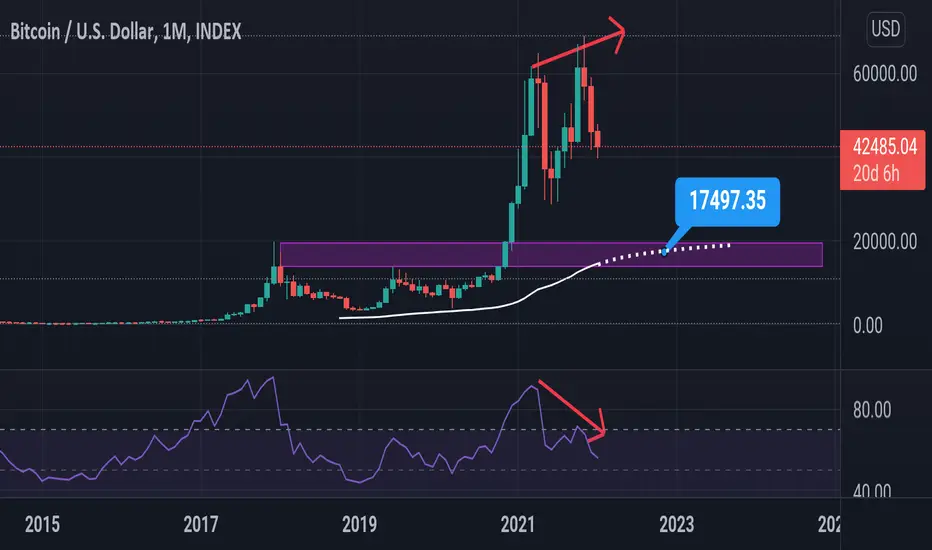
Look at the monthly timeframe
What do you see? Higher timeframes never lie and they're very simple to understand! We see a double top around 60_70K which is a very strong resistance also we see a bearish divergence because as price making higher highs RSI making lower highs also RSI is overbought. There's a support around 18_13K and also 100 monthly EMA is exactly there to support the price in future. These are very simple and obvious. Now you look at the chart and tell me what do you expect from bitcoin?
What do you see? Higher timeframes never lie and they're very simple to understand! We see a double top around 60_70K which is a very strong resistance also we see a bearish divergence because as price making higher highs RSI making lower highs also RSI is overbought. There's a support around 18_13K and also 100 monthly EMA is exactly there to support the price in future. These are very simple and obvious. Now you look at the chart and tell me what do you expect from bitcoin?
Ghi chú
As you see guys higher timeframes never lie. When we're bearish in higher timeframes it means indeed we're bearish in longterm.17K is in sight.

Bài đăng liên quan
Thông báo miễn trừ trách nhiệm
Thông tin và các ấn phẩm này không nhằm mục đích, và không cấu thành, lời khuyên hoặc khuyến nghị về tài chính, đầu tư, giao dịch hay các loại khác do TradingView cung cấp hoặc xác nhận. Đọc thêm tại Điều khoản Sử dụng.
Bài đăng liên quan
Thông báo miễn trừ trách nhiệm
Thông tin và các ấn phẩm này không nhằm mục đích, và không cấu thành, lời khuyên hoặc khuyến nghị về tài chính, đầu tư, giao dịch hay các loại khác do TradingView cung cấp hoặc xác nhận. Đọc thêm tại Điều khoản Sử dụng.