
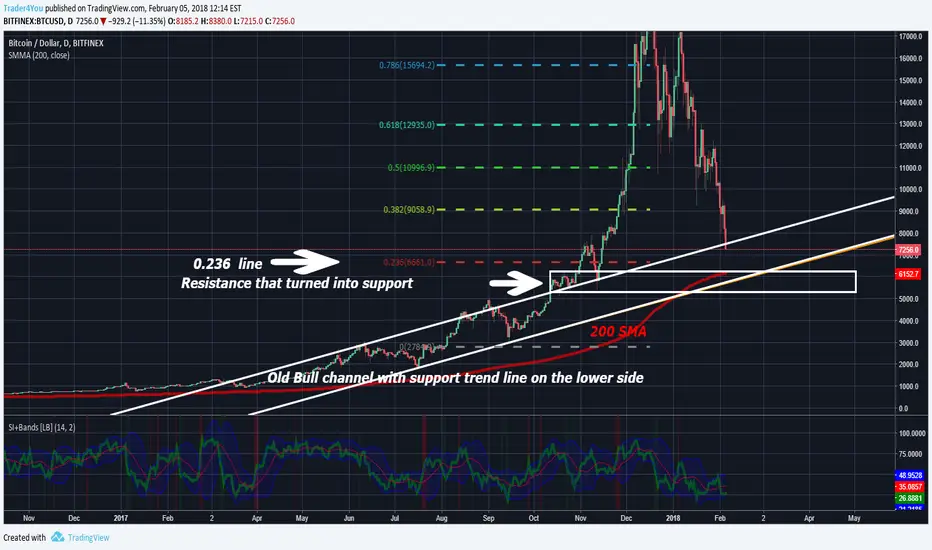
Daily Chart
Approaching
1. previous support area, check the box
2. 200 SMA
3. Fibonacci Support level
4. Main upward channel that the whole movement started from
5. Trendline on the lower side of the channel
Indicators:
Oversold on the RSI with divergence
Against: Momentum is steep
Await confirmation through price action
Zoom in 4 hours for timing of entry
but the expectation is
6 to 7 K area should see Bulls Stepping back in
Please trade your own taste
That is my opinion and not a trade advise
Approaching
1. previous support area, check the box
2. 200 SMA
3. Fibonacci Support level
4. Main upward channel that the whole movement started from
5. Trendline on the lower side of the channel
Indicators:
Oversold on the RSI with divergence
Against: Momentum is steep
Await confirmation through price action
Zoom in 4 hours for timing of entry
but the expectation is
6 to 7 K area should see Bulls Stepping back in
Please trade your own taste
That is my opinion and not a trade advise
Ghi chú
The Fork in playGhi chú
Volumes on the 4 hourly chart are significantly higher than average Accumulation started
Ghi chú
Could it be our good box, the close of the daily bar above 7k is significant Giao dịch đang hoạt động
and this small tight range bar with very high volume is Scary 
Thông báo miễn trừ trách nhiệm
Thông tin và các ấn phẩm này không nhằm mục đích, và không cấu thành, lời khuyên hoặc khuyến nghị về tài chính, đầu tư, giao dịch hay các loại khác do TradingView cung cấp hoặc xác nhận. Đọc thêm tại Điều khoản Sử dụng.
Thông báo miễn trừ trách nhiệm
Thông tin và các ấn phẩm này không nhằm mục đích, và không cấu thành, lời khuyên hoặc khuyến nghị về tài chính, đầu tư, giao dịch hay các loại khác do TradingView cung cấp hoặc xác nhận. Đọc thêm tại Điều khoản Sử dụng.