
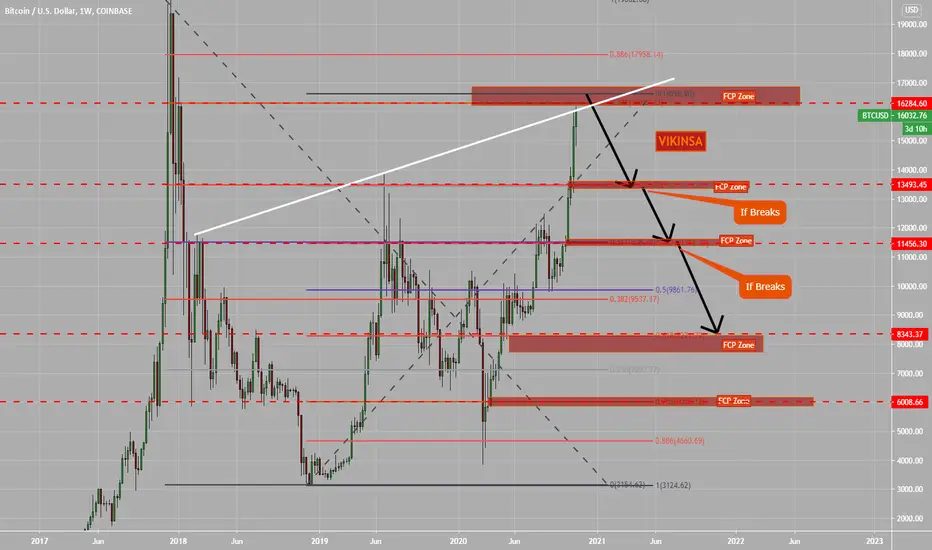
Traders, BitCoin (BTCUSD) had an amazing gravity defying rally in last few weeks/months. This is true sense has been a parabolic move. However there are now growing chances of a correction.
On monthly time frame a W pattern is about to complete between 16280 and 17000. This is a high probability Sell Fibonacci Confluence Zone with multiple fibonacci levels from multiple time frames coming together. This is where I will be looking to take profits on long and plan for a short.
If it starts to fall from this zone the next approximate zones for the correction to reach will be around these levels. If one zone is broken then the next will have high probability of reaching. These zone can also act as new levels to take profits on short positions and go long again based on your confirmation techniques.
Target Zone 1: 13500
Target Zone 2: 11500
Target Zone 3: 8300
Target Zone 4: 6000
Stay safe and trade well
-Vik
If you found this idea useful, hit the like button and subscribe. If you have your own ideas to share on this market or have a question, comment below so that we can discuss.
Disclaimer:
The content on this analysis is subject to change at any time without notice, and is provided for the sole purpose of education only. Not a financial advice or signal. Please make your own independent investment decisions.
____________________________________________________
On monthly time frame a W pattern is about to complete between 16280 and 17000. This is a high probability Sell Fibonacci Confluence Zone with multiple fibonacci levels from multiple time frames coming together. This is where I will be looking to take profits on long and plan for a short.
If it starts to fall from this zone the next approximate zones for the correction to reach will be around these levels. If one zone is broken then the next will have high probability of reaching. These zone can also act as new levels to take profits on short positions and go long again based on your confirmation techniques.
Target Zone 1: 13500
Target Zone 2: 11500
Target Zone 3: 8300
Target Zone 4: 6000
Stay safe and trade well
-Vik
If you found this idea useful, hit the like button and subscribe. If you have your own ideas to share on this market or have a question, comment below so that we can discuss.
Disclaimer:
The content on this analysis is subject to change at any time without notice, and is provided for the sole purpose of education only. Not a financial advice or signal. Please make your own independent investment decisions.
____________________________________________________
Ghi chú
inner zone: Ghi chú
Looking good so far. It is falling from the FCP zone. The trade is already in profit and de-risked.
🔵 Free Telegram Channel: t.me/VikinsaFx
🔴 Training: bit.ly/vikinsacorestrategyprogram
🟣 YouTube : youtube.com/vikinsa
🟡 Twitter: twitter.com/vikinsa
🔴 Reviews: bit.ly/VikinsaTrustPilotViews
🔴 Training: bit.ly/vikinsacorestrategyprogram
🟣 YouTube : youtube.com/vikinsa
🟡 Twitter: twitter.com/vikinsa
🔴 Reviews: bit.ly/VikinsaTrustPilotViews
Thông báo miễn trừ trách nhiệm
Thông tin và các ấn phẩm này không nhằm mục đích, và không cấu thành, lời khuyên hoặc khuyến nghị về tài chính, đầu tư, giao dịch hay các loại khác do TradingView cung cấp hoặc xác nhận. Đọc thêm tại Điều khoản Sử dụng.
🔵 Free Telegram Channel: t.me/VikinsaFx
🔴 Training: bit.ly/vikinsacorestrategyprogram
🟣 YouTube : youtube.com/vikinsa
🟡 Twitter: twitter.com/vikinsa
🔴 Reviews: bit.ly/VikinsaTrustPilotViews
🔴 Training: bit.ly/vikinsacorestrategyprogram
🟣 YouTube : youtube.com/vikinsa
🟡 Twitter: twitter.com/vikinsa
🔴 Reviews: bit.ly/VikinsaTrustPilotViews
Thông báo miễn trừ trách nhiệm
Thông tin và các ấn phẩm này không nhằm mục đích, và không cấu thành, lời khuyên hoặc khuyến nghị về tài chính, đầu tư, giao dịch hay các loại khác do TradingView cung cấp hoặc xác nhận. Đọc thêm tại Điều khoản Sử dụng.