
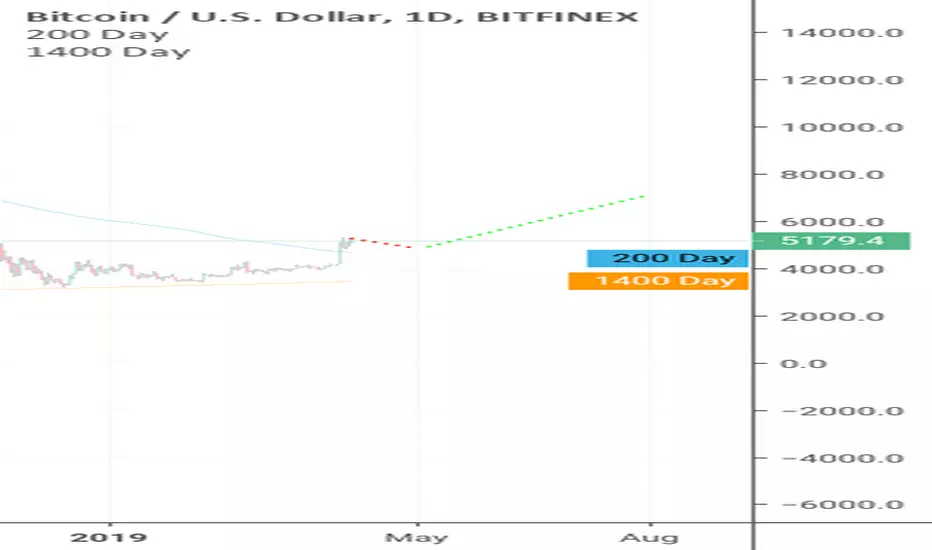
These two lines aren't meant to be exact levels as to where btc will fall to or grow, but more of a realistic play to eventually follow the 200 day average and pull it upward with higher highs and higher lows. Basically a short dip for perhaps a month where btc feels like it trades sideways before it starts to take off towards the 6k mark, but probably not as rapidly as people suspect. This is more of a bullish TA based on trends observed during the last time btc crossed the 200 day and slowly increased in price aprox around Oct 2015. If the buys increase rapidly or the sells break below the 200 day line, this concept will be invalidated.

Thông báo miễn trừ trách nhiệm
Thông tin và các ấn phẩm này không nhằm mục đích, và không cấu thành, lời khuyên hoặc khuyến nghị về tài chính, đầu tư, giao dịch hay các loại khác do TradingView cung cấp hoặc xác nhận. Đọc thêm tại Điều khoản Sử dụng.
Thông báo miễn trừ trách nhiệm
Thông tin và các ấn phẩm này không nhằm mục đích, và không cấu thành, lời khuyên hoặc khuyến nghị về tài chính, đầu tư, giao dịch hay các loại khác do TradingView cung cấp hoặc xác nhận. Đọc thêm tại Điều khoản Sử dụng.