
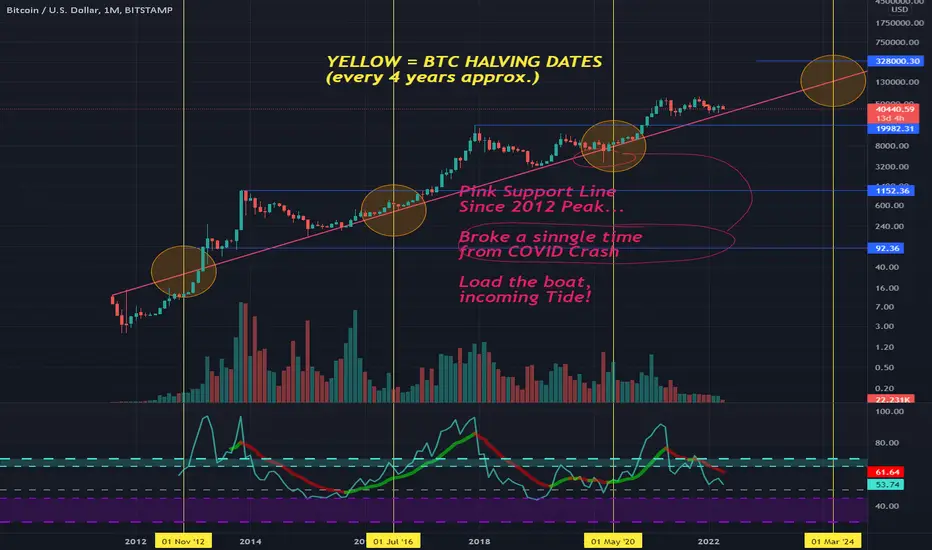
Each of the Vertical yellow lines represent the month/year of the bitcoin halvings (not including Jan2009)**LOGARITHMIC Chart**
Pink Line shows the support line that has been trending since 2012, nearly inception. :) Thank you network effect. (google that if you don't know it!!)
The orange(ish) circles are all exactly the same size. The peaks correlate directly to the top of the circles, after each halving but w/ a longer duration of time. (lengthening cycles, google it) This TA shows a peak around $328,000 well on its way this year 2022, but touching the support line once more again afterward to then carry its growth trajectory…
Pink Line shows the support line that has been trending since 2012, nearly inception. :) Thank you network effect. (google that if you don't know it!!)
The orange(ish) circles are all exactly the same size. The peaks correlate directly to the top of the circles, after each halving but w/ a longer duration of time. (lengthening cycles, google it) This TA shows a peak around $328,000 well on its way this year 2022, but touching the support line once more again afterward to then carry its growth trajectory…

Thông báo miễn trừ trách nhiệm
Thông tin và các ấn phẩm này không nhằm mục đích, và không cấu thành, lời khuyên hoặc khuyến nghị về tài chính, đầu tư, giao dịch hay các loại khác do TradingView cung cấp hoặc xác nhận. Đọc thêm tại Điều khoản Sử dụng.
Thông báo miễn trừ trách nhiệm
Thông tin và các ấn phẩm này không nhằm mục đích, và không cấu thành, lời khuyên hoặc khuyến nghị về tài chính, đầu tư, giao dịch hay các loại khác do TradingView cung cấp hoặc xác nhận. Đọc thêm tại Điều khoản Sử dụng.