
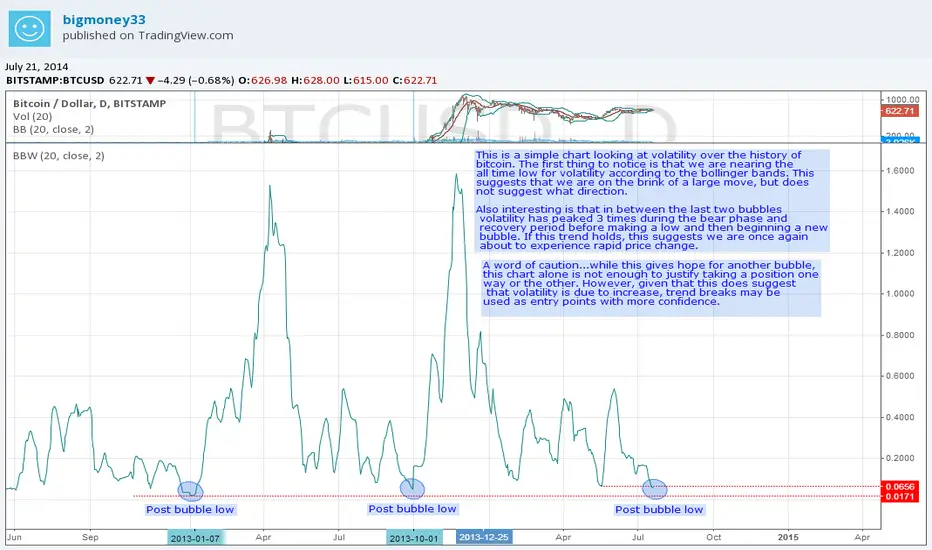
This is a simple chart looking at volatility over the history of bitcoin. The first thing to notice is that we are nearing the all time low for volatility according to the bollinger bands. This suggests that we are on the brink of a large move, but does not suggest what direction.
Also interesting is that in between the last two bubbles volatility has peaked 3 times during the bear phase and recovery period before making a low and then beginning a new bubble. If this trend holds, this suggests we are once again about to experience rapid price change.
A word of caution...while this gives hope for another bubble, this chart alone is not enough to justify taking a position one way or the other. However, given that this does suggest that volatility is due to increase, trend breaks may be used as entry points with more confidence.
Also interesting is that in between the last two bubbles volatility has peaked 3 times during the bear phase and recovery period before making a low and then beginning a new bubble. If this trend holds, this suggests we are once again about to experience rapid price change.
A word of caution...while this gives hope for another bubble, this chart alone is not enough to justify taking a position one way or the other. However, given that this does suggest that volatility is due to increase, trend breaks may be used as entry points with more confidence.

Thông báo miễn trừ trách nhiệm
Thông tin và các ấn phẩm này không nhằm mục đích, và không cấu thành, lời khuyên hoặc khuyến nghị về tài chính, đầu tư, giao dịch hay các loại khác do TradingView cung cấp hoặc xác nhận. Đọc thêm tại Điều khoản Sử dụng.
Thông báo miễn trừ trách nhiệm
Thông tin và các ấn phẩm này không nhằm mục đích, và không cấu thành, lời khuyên hoặc khuyến nghị về tài chính, đầu tư, giao dịch hay các loại khác do TradingView cung cấp hoặc xác nhận. Đọc thêm tại Điều khoản Sử dụng.