
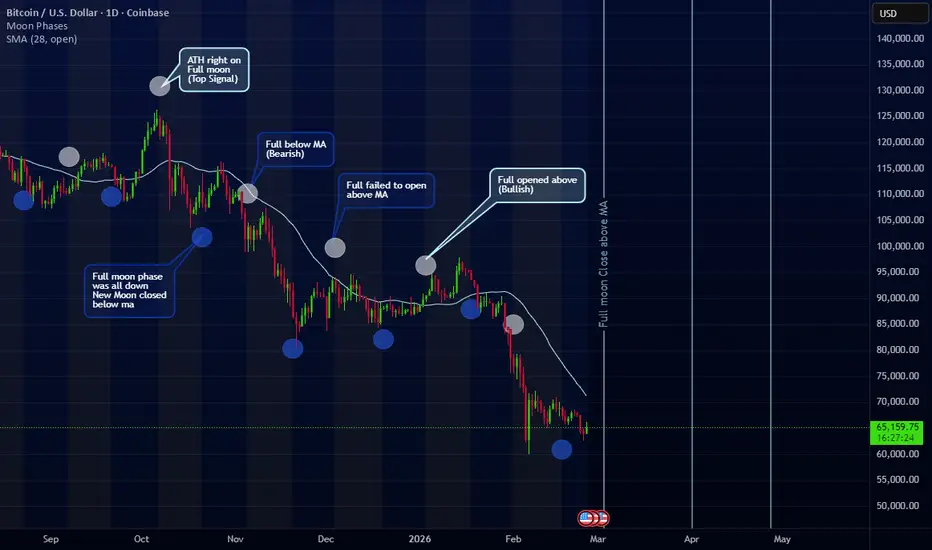
I'm creating this idea to test a strategy using moon phases and a single moving average. This is an experimental idea for me to test this strategy and see how well it preforms theoretically. I'll conclude this idea if via testing we are able to see consistent results. This idea is only for the daily timeframe until further notice. I may add to or change the strategy as we go along but I will attempt not to by much.
The moving average is a 28 day simple moving average which I call the lunar moving average. The average length of a moon cycle is 4 weeks which is 28 days. We are using this in combination with the moon phases indicator which I've adjusted by putting full moons on top and new moons on bottom.
This strategy is a confirmation tool and not meant to be your all in one trading strategy. I am currently bullish on BTC and view what we are currently on as a support

So I am buying here. We will now use the strategy to confirm to us that this is a good spot by the next moon phase opening above the 28SMA. Let's see how we do
The moving average is a 28 day simple moving average which I call the lunar moving average. The average length of a moon cycle is 4 weeks which is 28 days. We are using this in combination with the moon phases indicator which I've adjusted by putting full moons on top and new moons on bottom.
This strategy is a confirmation tool and not meant to be your all in one trading strategy. I am currently bullish on BTC and view what we are currently on as a support
So I am buying here. We will now use the strategy to confirm to us that this is a good spot by the next moon phase opening above the 28SMA. Let's see how we do
Giao dịch đang hoạt động
My current position is bullish on BTC. I'm waiting to see if on the next full moon we open above the 28ma. To summarize this strat.Full moon = Generally Bullish
New moon = Generally Bearish
Full moon + above ma = Bullish confirmation
New moon + below ma = Bearish confirmation
Full moon + below ma = Bearish
New moon + above ma = Bullish
Let's see how this goes. I will update on the full moon
Ghi chú
I decided to change candle color to match the lunar theme as well as add a 14SMA since there's two weeks between full moon and new moon. The full moon is just around the corner so if we open and close above the 28MA that will be our bullish confirmation signal Ghi chú
Full moon candle has opened and closed above the 28MA, this is the bullish confirmation we've been waiting for so let's see how price reacts until the new moon. Ghi chú
Price is reacting as expected, this adds some points to the strat being viable. I will update on the new moon to see where price closes relative to the MA. If the new moon is above the 28ma that's a bullish sign that the trend is still going strong Ghi chú
New moon has opened and closed above the 28ma which should be a bullish sign, let's see how price continues to react Ghi chú
Full moon candle closed below against usd which is a bearish sign. However it did close above against gold so if btc continues doing well against gold I will keep holding onto my btc, it not that could be our confirmation to sell. I'm curious to see how this next month plays out Ghi chú
bitcoin did end up doing good against gold which helped bring us back above the 28MA on the USD chart 
Thông báo miễn trừ trách nhiệm
Thông tin và các ấn phẩm này không nhằm mục đích, và không cấu thành, lời khuyên hoặc khuyến nghị về tài chính, đầu tư, giao dịch hay các loại khác do TradingView cung cấp hoặc xác nhận. Đọc thêm tại Điều khoản Sử dụng.
Thông báo miễn trừ trách nhiệm
Thông tin và các ấn phẩm này không nhằm mục đích, và không cấu thành, lời khuyên hoặc khuyến nghị về tài chính, đầu tư, giao dịch hay các loại khác do TradingView cung cấp hoặc xác nhận. Đọc thêm tại Điều khoản Sử dụng.