My First Bitcoin Basic Technical Analysis
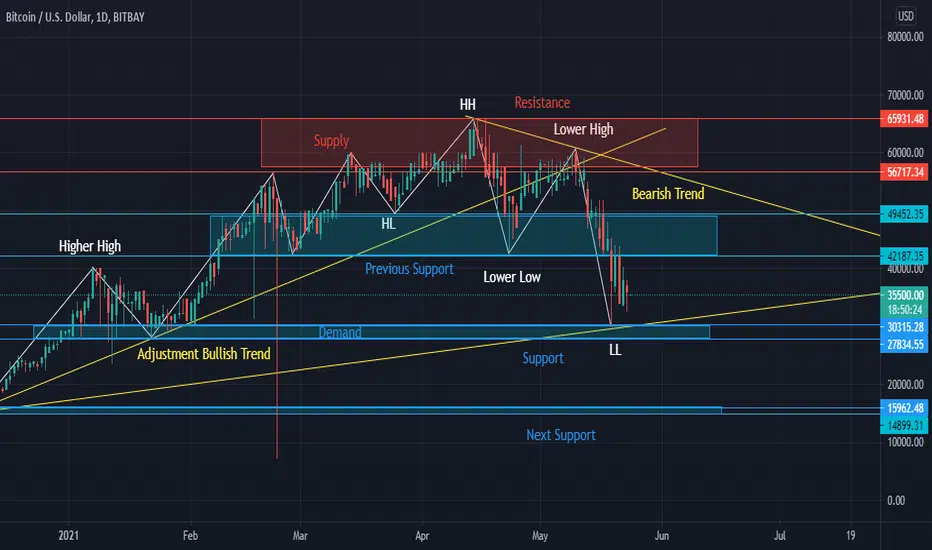
The 4 Basics:
1. Swing: in white line.
2. Trend: in yellow line.
3. Support & Resistance: Blue and Red lines.
4. Supply & Demand: in rectangles.
Summary:
The current trend is bearish after failing to break above $60000 and failing to maintain above $46000. A good buy opportunity between $28000 - $30000 especially if there is a rebound. However, a high probability of another market crash if the price drops below $28000 up to $16000 as the next support line.

Thông báo miễn trừ trách nhiệm
Thông tin và các ấn phẩm này không nhằm mục đích, và không cấu thành, lời khuyên hoặc khuyến nghị về tài chính, đầu tư, giao dịch hay các loại khác do TradingView cung cấp hoặc xác nhận. Đọc thêm tại Điều khoản Sử dụng.
Thông báo miễn trừ trách nhiệm
Thông tin và các ấn phẩm này không nhằm mục đích, và không cấu thành, lời khuyên hoặc khuyến nghị về tài chính, đầu tư, giao dịch hay các loại khác do TradingView cung cấp hoặc xác nhận. Đọc thêm tại Điều khoản Sử dụng.