
Technical Analysis and Outlook:
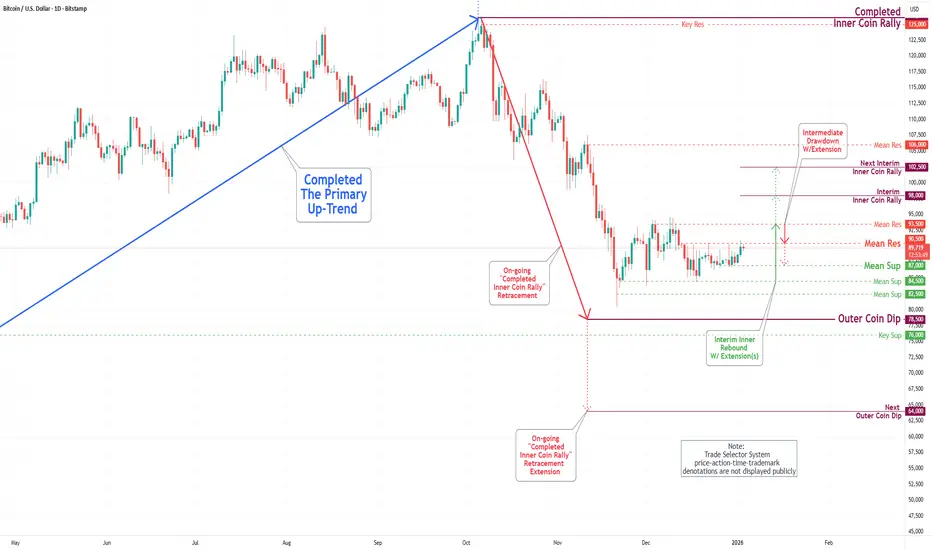
In this New Year's trading week, the Bitcoin market has climbed towards the upper end of our Active Inner Trading Zone (See Daily Chart Analysis For Week of Dec 26, 2025). This breakout from his progressive zone will be met by Mean Resistance at 93,500.
Given the prevailing dynamics in the cryptocurrency market, it is recommended that traders diligently monitor this price movement, as significant momentum is pushing prices toward the Interim Inner Coin Rally at 98,000 and the possibility of advancing to a subsequent Interim Coin Rally at 102,500.
On the downside, the principal target, identified for some time, is the Outer Coin Dip at 78,500, which might be realized once the Mean Resistance 93,500 is hit, along with the Interim Coin Rally at 102,500.
In this New Year's trading week, the Bitcoin market has climbed towards the upper end of our Active Inner Trading Zone (See Daily Chart Analysis For Week of Dec 26, 2025). This breakout from his progressive zone will be met by Mean Resistance at 93,500.
Given the prevailing dynamics in the cryptocurrency market, it is recommended that traders diligently monitor this price movement, as significant momentum is pushing prices toward the Interim Inner Coin Rally at 98,000 and the possibility of advancing to a subsequent Interim Coin Rally at 102,500.
On the downside, the principal target, identified for some time, is the Outer Coin Dip at 78,500, which might be realized once the Mean Resistance 93,500 is hit, along with the Interim Coin Rally at 102,500.

Bài đăng liên quan
Thông báo miễn trừ trách nhiệm
Thông tin và các ấn phẩm này không nhằm mục đích, và không cấu thành, lời khuyên hoặc khuyến nghị về tài chính, đầu tư, giao dịch hay các loại khác do TradingView cung cấp hoặc xác nhận. Đọc thêm tại Điều khoản Sử dụng.
Thông báo miễn trừ trách nhiệm
Thông tin và các ấn phẩm này không nhằm mục đích, và không cấu thành, lời khuyên hoặc khuyến nghị về tài chính, đầu tư, giao dịch hay các loại khác do TradingView cung cấp hoặc xác nhận. Đọc thêm tại Điều khoản Sử dụng.