
Description:
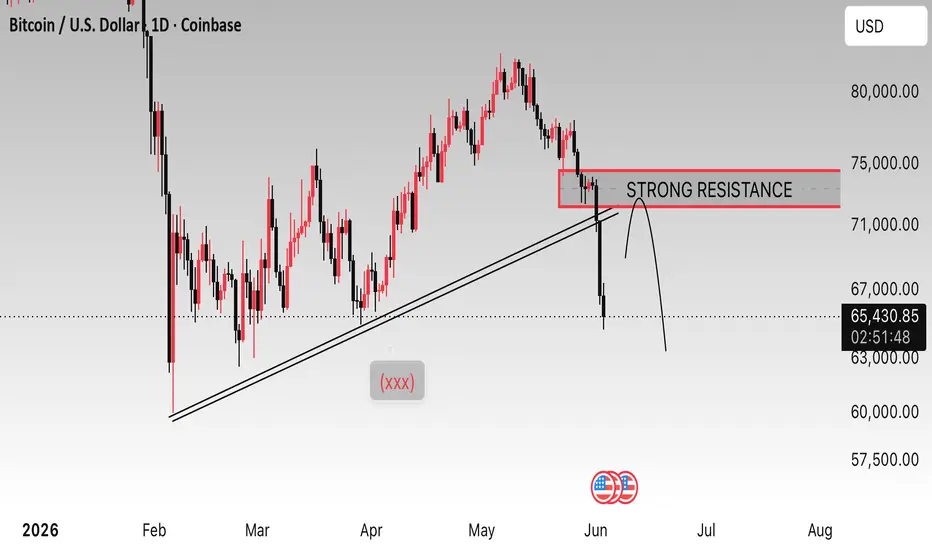
This daily Bitcoin (BTC/USD) chart shows a decisive rejection from a major resistance zone around $72,000–$74,000. Price has broken below a key ascending trendline that previously supported the uptrend, signaling weakening bullish momentum. The highlighted resistance area remains a critical level to watch, and any retest could attract renewed selling pressure. If the breakdown is confirmed, Bitcoin may face further downside toward lower support levels in the coming sessions.
Not financial advice

Thông báo miễn trừ trách nhiệm
Thông tin và các ấn phẩm này không nhằm mục đích, và không cấu thành, lời khuyên hoặc khuyến nghị về tài chính, đầu tư, giao dịch hay các loại khác do TradingView cung cấp hoặc xác nhận. Đọc thêm tại Điều khoản Sử dụng.
Thông báo miễn trừ trách nhiệm
Thông tin và các ấn phẩm này không nhằm mục đích, và không cấu thành, lời khuyên hoặc khuyến nghị về tài chính, đầu tư, giao dịch hay các loại khác do TradingView cung cấp hoặc xác nhận. Đọc thêm tại Điều khoản Sử dụng.