
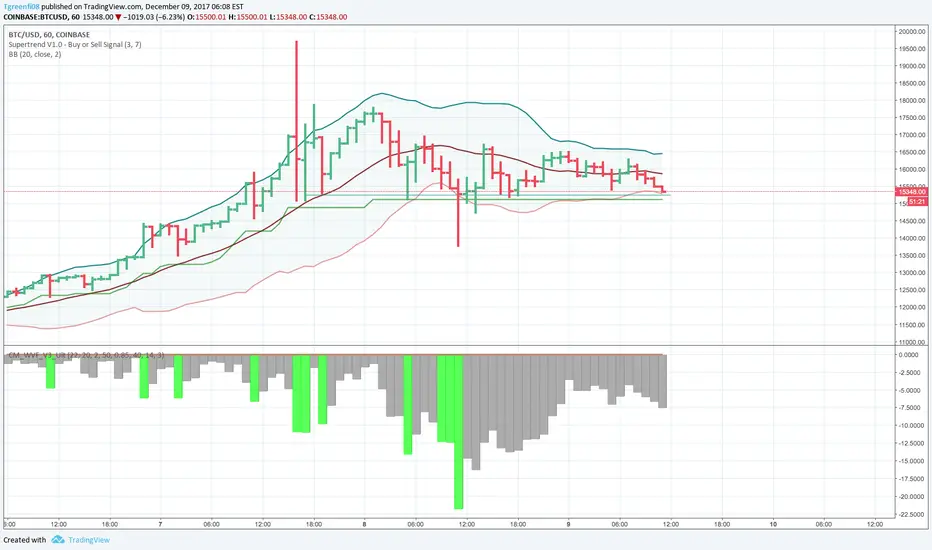
As a followup to my last post, this is another way to see if you're catching Bitcoin in a swing.
If the price is way above the Bollinger Bands, it's an indicator that you may want to sell, and buy it back at a lower price. Way below? This is a good indication that you may want to buy. Combine this with the CM_Williams_VIx_Fix_V3_Ultimate_Filtered_Alerts, and this can be another supportive indicator of whether the price is outside of the norm. With this indicator, it seems to me that both the thickness (multiple bars together) and/or length of the green bars are indicators of abnormal price activity.
See previous post for the fuller strategy.

Thông báo miễn trừ trách nhiệm
Thông tin và các ấn phẩm này không nhằm mục đích, và không cấu thành, lời khuyên hoặc khuyến nghị về tài chính, đầu tư, giao dịch hay các loại khác do TradingView cung cấp hoặc xác nhận. Đọc thêm tại Điều khoản Sử dụng.
Thông báo miễn trừ trách nhiệm
Thông tin và các ấn phẩm này không nhằm mục đích, và không cấu thành, lời khuyên hoặc khuyến nghị về tài chính, đầu tư, giao dịch hay các loại khác do TradingView cung cấp hoặc xác nhận. Đọc thêm tại Điều khoản Sử dụng.