
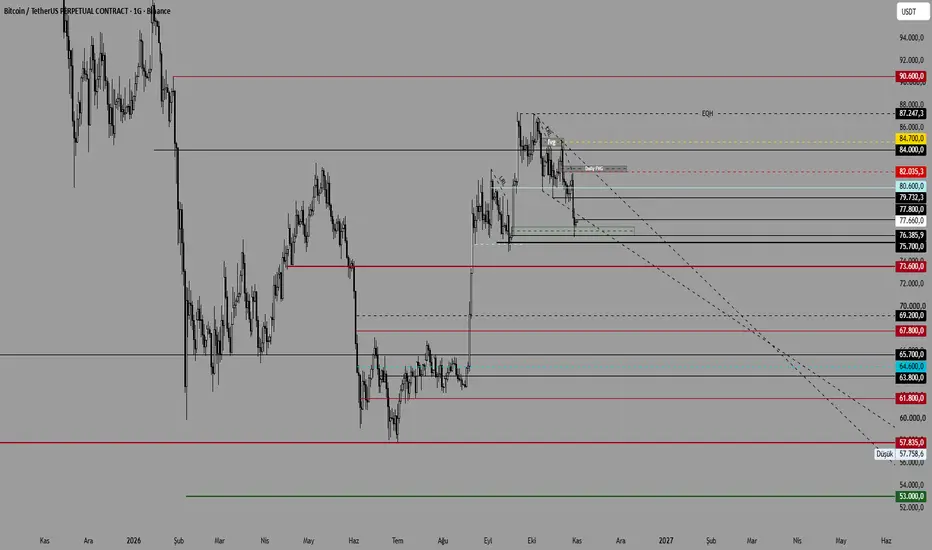
Önemli seviyeler grafikte belirttiğim gibidir. 75,7 üstünde kalması, yükselişin devamı için önemli bir bölge olarak karşımıza çıkıyor.
Kısa periyotta 77,8 / 79,2 / 80,6 seviyelerini takip etmek gerekiyor. 82,6 üstünde kalıcı olamadığı sürece baskı devam eder. Kalıcı olması durumunda ise 87,3 / 90 bölgesi takip edilir.
Aksi senaryoda 73,6 / 69,2 / 67,8 bölgesine kadar olan alan takip edilir.
17 Ocak 2027 tarihine kadar da gözlerin 77,3 seviyesinde olması gerekiyor. 77,3 altında short, üstünde long şeklinde değerlendirilir.
────────────────────────────
The key levels are as indicated on the chart. Holding above 75.7 is an important condition for the continuation of the upward move.
In the short term, the levels to watch are 77.8 / 79.2 / 80.6. As long as price fails to establish a sustained move above 82.6, selling pressure is expected to continue. If price manages to hold above 82.6, the 87.3 / 90 zone will be the next area to watch.
In the alternative scenario, the 73.6 / 69.2 / 67.8 levels should be monitored on the downside.
Until January 17, 2027, all eyes should remain on the 77.3 level. Below 77.3, the bias is short; above 77.3, the bias is long.
Kısa periyotta 77,8 / 79,2 / 80,6 seviyelerini takip etmek gerekiyor. 82,6 üstünde kalıcı olamadığı sürece baskı devam eder. Kalıcı olması durumunda ise 87,3 / 90 bölgesi takip edilir.
Aksi senaryoda 73,6 / 69,2 / 67,8 bölgesine kadar olan alan takip edilir.
17 Ocak 2027 tarihine kadar da gözlerin 77,3 seviyesinde olması gerekiyor. 77,3 altında short, üstünde long şeklinde değerlendirilir.
────────────────────────────
The key levels are as indicated on the chart. Holding above 75.7 is an important condition for the continuation of the upward move.
In the short term, the levels to watch are 77.8 / 79.2 / 80.6. As long as price fails to establish a sustained move above 82.6, selling pressure is expected to continue. If price manages to hold above 82.6, the 87.3 / 90 zone will be the next area to watch.
In the alternative scenario, the 73.6 / 69.2 / 67.8 levels should be monitored on the downside.
Until January 17, 2027, all eyes should remain on the 77.3 level. Below 77.3, the bias is short; above 77.3, the bias is long.

ferdigungor
Thông báo miễn trừ trách nhiệm
Thông tin và các ấn phẩm này không nhằm mục đích, và không cấu thành, lời khuyên hoặc khuyến nghị về tài chính, đầu tư, giao dịch hay các loại khác do TradingView cung cấp hoặc xác nhận. Đọc thêm tại Điều khoản Sử dụng.
ferdigungor
Thông báo miễn trừ trách nhiệm
Thông tin và các ấn phẩm này không nhằm mục đích, và không cấu thành, lời khuyên hoặc khuyến nghị về tài chính, đầu tư, giao dịch hay các loại khác do TradingView cung cấp hoặc xác nhận. Đọc thêm tại Điều khoản Sử dụng.