
# 📈 PRO Scalper: How to Read the Market Through VWAP, Zones, Delta & Liquidity
In scalping, the problem is rarely that a trader doesn’t see a signal.
More often, it’s the opposite:
you see too many signals at once.
A candle moves up — you want to buy.
Price touches a zone — you want to catch a reversal.
Volume spikes — it feels like something big is about to happen.
A level breaks — your finger is already on the button.
And then the market does what it does best:
it punishes impatience and incomplete context.
Because in reality:
PRO Scalper is NOT a Signal Tool
PRO Scalper is not a buy/sell arrow machine.
It is a market map, not a signal generator.
Instead of telling you what to do, it helps you understand:
What is actually happening in the market:
Core Idea
👉 PRO Scalper does NOT trade for you.
👉 It removes noise so you can trade with structure.
1. What is PRO Scalper
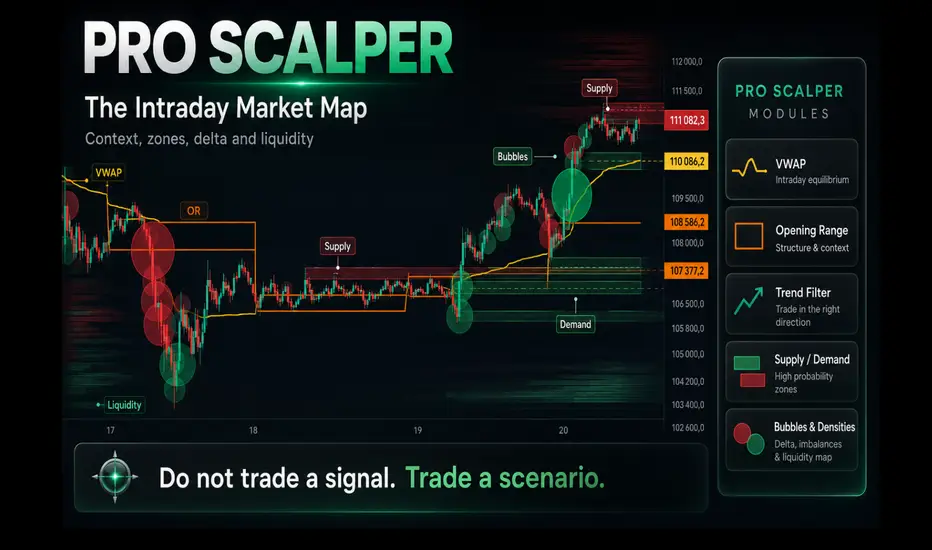
PRO Scalper is an intraday price action + liquidity framework designed for fast decision-making with context.
It combines multiple market layers into one unified view:
VWAP
Opening Range
Trend Filter
Supply / Demand Zones
Delta Bubbles
Liquidity Densities
Key Principle
👉 The goal is NOT visual complexity.
👉The goal is clarity of context.
Because:
Example:
Final Idea
👉 PRO Scalper helps you stop reading single events — and start reading market sequences.

2. Core Execution Formula
When working with this indicator, the process should always follow a strict order:
👉Context → Level → Effort → Plan → Risk
In exactly this sequence.
Never the other way around.
A common mistake traders make is reversing the logic:
That feels fast and intuitive — but in reality, it’s expensive over time.
A correct approach looks like this:
The difference is simple:
One is reacting to price. The other is trading a structured idea.
3. First Layer: VWAP
VWAP represents the average price the market has traded at during the session.
In simple terms:
👉VWAP is the intraday “fair value” reference.
When price is above VWAP, buyers are generally in control.
When price is below VWAP, sellers have the upper hand.
When price repeatedly rotates around VWAP, the market is likely balanced.
But VWAP is not a signal by itself.
It is important to avoid mechanical thinking:
VWAP defines context, not entries.
A valid scenario might look like this:
That is structured alignment — not randomness.
However, when price constantly oscillates around VWAP, breaking it both ways without follow-through, the market is likely in balance. In that environment, trend trades often fail.
👉VWAP answers a simple question: are we trading above or below intraday fair value?
4. Second Layer: Opening Range
The Opening Range defines the initial structure of the session.
In traditional markets, the first minutes or hours often set the tone for the entire day. They establish the initial balance that later expands or breaks.
In crypto, where trading is continuous, the concept still applies — we simply define a session start and observe how price behaves relative to that range.
The Opening Range can function as:
For example:
Price consolidates inside the Opening Range.
Then it breaks above the range high.
A strong bullish bubble appears on the breakout.
Later, price returns to retest the OR high and holds it.
This is not just price went up.
It is a sequence of structure:
balance → breakout → retest → confirmation
But the opposite scenario is equally important:
If price breaks above the OR high, quickly falls back inside the range, and prints a bearish bubble — that can signal a failed breakout or bull trap.
👉The Opening Range answers one key question: are we expanding out of balance, or still trapped inside it?

5. Third Layer: Trend Filter
PRO Scalper includes a built-in trend filter designed to help align trades with the dominant market direction.
It can be used in three different modes:
You can also combine this with higher timeframe bias, which is often just as important as any indicator setting.
This layer matters because lower timeframes are often deceptive.
What looks like a reversal on a 1–5 minute chart is frequently just a pullback within a larger higher timeframe trend.
The trend filter helps reduce this conflict by keeping you aligned with the broader structure instead of reacting to local noise.
When to use Off mode
Off mode is useful when you want full market visibility without restrictions.
You see everything:
This mode is best for discretionary traders who prefer manual interpretation.
The trade-off is simple: more information, but also more noise.
When to use EMA mode
EMA mode is designed for directional trading.
It filters setups based on trend alignment:
This creates a cleaner environment where you are primarily trading with momentum instead of against it.
The chart becomes more selective — but also more structured.
When to use EMA + ADX mode
EMA + ADX mode is the strictest filter and is used when both direction and strength matter.
While EMA defines *direction*, ADX helps confirm whether the market is actually trending or just moving sideways.
This distinction is critical in choppy conditions where directional signals alone are unreliable.
Simple interpretation:
Simple framework

6. Fourth Layer: Supply & Demand Zones
Supply and demand zones are one of the core modules of PRO Scalper.
But one important misconception must be removed:
Demand zone is NOT a Buy button.
Supply zone is NOT a Sell button.
A zone is an area where price reacted before — and may react again.
Keyword: may
Not must.
👉Zones are built from pivots and adjusted using ATR. This means they adapt to volatility: wide market → wider zones; calm market → tighter zones.
There are two types:
* larger structural zones;
* faster intraday zones.

7. How to Read Zones
Zones should never be read in isolation. Their meaning always depends on context.
Instead of treating a zone as a static buy or sell area, it’s better to evaluate it through a set of structured questions.
1. Where is the zone relative to VWAP?
VWAP acts as the intraday fair value reference, so the position of a zone around it changes its behavior:
VWAP helps you understand whether a zone is being traded against value or with it.
2. Is it with or against the trend?
Trend context determines the importance of the zone:
A zone aligned with trend has significantly higher probability of follow-through than one traded against structure.
3. How many times was it tested?
Every retest reduces the strength of a zone.
More touches = less liquidity left in the area.
This is where the touch counter becomes useful — it helps measure exhaustion rather than assuming all zones remain equally valid over time.
4. Is there a reaction?
A simple tap of a zone is not a reaction.
A valid reaction usually shows intent or rejection, such as:
Reaction is what gives a zone meaning — not the touch itself.
5. Where is invalidation?
If you cannot define where the idea fails, it is not a trade — it is only a hypothesis.
Every zone-based idea must have a clear invalidation point.
Without it, there is no structure, only expectation.
8. Midline Zones
The midline is the midpoint of a zone.
At first glance, it seems like a minor detail — but in practice, it often becomes a key decision area.
The midline can be used as:
Example (Long setup)
This sequence is significantly stronger than simply reacting to the first touch of Demand.
Example (Short setup)
👉The logic is mirrored, but the principle is the same:
👉midline reclaim = confirmation that the market accepted the move back inside the zone

9. Delta Bubbles: What Bubbles Show
Bubbles represent a visualization of unusual pressure in the market.
A green bubble reflects buying pressure, while a red bubble reflects selling pressure. The size of the bubble indicates how strong that pressure is relative to recent price action.
It’s important to understand what this actually is — and what it is not.
This is not raw exchange order flow.
It is a proxy built from OHLCV data.
In other words, it estimates pressure based on what is visible on the chart. That makes it useful, but not absolute.
How NOT to use bubbles
A common mistake is treating bubbles as direct signals:
This approach is overly simplistic and usually leads to inconsistent results.
A bubble only shows effort. And effort alone does not define direction.
The same pressure can lead to very different outcomes:
Without context, the same signal can mean completely opposite things.
How to properly use bubbles
Bubbles only become meaningful when combined with structure.
They should always be read in relation to levels, context, and market location.
For example:
Core idea
A bubble is not a trade.
It is information about effort.
👉And effort only becomes meaningful when it aligns with:
👉structure → level → context → plan
👉Without that alignment, it remains just noise on the chart.

10. Liquidity Densities
Densities represent a more advanced but highly useful layer of market structure.
They highlight areas where significant activity has occurred.
This can reflect:
In simple terms:
👉Density shows where the market left a footprint.
👉And the market often remembers these footprints.
How price interacts with density
Price does not treat density in a single way. Its behavior depends on context:
When high activity disappears quickly after a strong move, it can be interpreted as the area being consumed — meaning liquidity has been taken and the path is now clearer.
However, this is not a standalone signal.
If density is analyzed without context, it becomes unreliable.
But when density is broken in the direction of trend, especially near an Opening Range breakout or supported by a bubble, it becomes part of a valid scenario rather than random noise.
11. How to Set Up PRO Scalper
Now let’s go through the setup logic from a trading perspective, not just a technical checklist.
Core Settings
ATR Length
ATR is used to adapt zones and densities to market volatility.
The default value of 14 is a solid starting point.
However:
There is no perfect value — it depends on market conditions and trading style.
Show Session VWAP
It is generally recommended to keep this enabled for scalping.
VWAP acts as a key intraday reference point, helping define:
Show Opening Range
This should usually be enabled for intraday trading.
The Opening Range helps you identify:
It gives context to early session movement instead of treating price as random.
OR Auto vs Manual
For crypto markets, both approaches are valid since price is continuous and traditional session structure is less rigid than in equities.
Testing both modes can help you understand which fits your strategy better.

Trend Filter
👉For Pure Trend Scalping
In strong directional markets, the goal is simple: stay with the trend and avoid countertrend noise.
Recommended setup:
The main idea here is filtering out low-quality countertrend setups and focusing only on momentum aligned entries.
👉For Reversal Scenarios
When trading reversals, you want less filtering, more raw structure visibility.
Use:
This setup allows you to see more market interactions, including:
Reversals are about context — not filtering everything out.
👉For Breakout Scenarios
Breakouts require confirmation, not assumptions.
Recommended:
EMA + ADX
HTF confirmation enabled
Opening Range (OR) filter
Higher bubble quantile to isolate strong impulses
This helps you focus only on high-momentum expansions, avoiding fake breakouts.
Zones
Zone Depth
Zone behavior depends heavily on depth settings:
If zones are too narrow → they get constantly violated by noise
If zones are too wide → they lose precision and become meaningless
The goal is balance: zones should reflect real reaction areas, not random micro-fluctuations.
Extend Bars
For scalping, zone extension should be limited.
Overextended zones reduce readability and make structure harder to interpret.
Pair A and Pair B
Think of this as a dual-layer structure model:
Practical usage:
Only in Trend Zones
This filter helps clean up the chart by aligning zones with the prevailing direction.
Beginners benefit from keeping it ON.
Advanced traders may disable it to read full market complexity.
Bubbles
Quantile Lookback
This defines how the indicator interprets “normal vs abnormal” activity.
Quantile %
Controls signal frequency:
Recommended starting range: 85–90
Densities
Metric Selection: AbsDelta vs Volume
In crypto markets, AbsDelta often provides cleaner insight into aggressive participation.
Quantile %
Higher thresholds reduce noise:
Adjust depending on market conditions and chart clutter.
Merge Distance
This parameter helps combine nearby density zones into one:
Break Volume Delete
If a density level is broken with strong volume, it gets removed.
Market interpretation:
The level has been fully consumed.
This helps keep only relevant, active structure on the chart.
12. Ready-Made Presets for Different Styles
These presets are starting frameworks, not fixed rules. They should always be adapted to instrument, volatility, and fees.
Preset 1: Clean Trend Scalping
Designed for directional markets with clear structure.
Suitable for:
Core Logic
Trade pullbacks in the direction of the higher timeframe trend.
Settings
When to Use
When NOT to Use
Preset 3: Opening Range Breakout
This preset is designed for trading breakouts from the initial balance range, where the market transitions from consolidation into expansion.
Logic
Wait for the Opening Range (OR) to fully form, then look for:
👉The key idea is not to chase the breakout, but to wait for confirmation that the market has accepted the new direction.

Settings
When to Use
When NOT to Use
Preset 4: Minimal Manual Mode
This mode is built for experienced traders who prefer discretionary reading of price action over strict system filtering.
Logic
No rigid structure enforcement.
You rely on market context, price behavior, and zone interaction.
Settings
When to Use
When NOT to Use
13. Trading Scenarios Using PRO Scalper
This section translates the tool into real execution logic — how setups actually form in live conditions.
Scenario 1: Trend Pullback Scalp
Idea
Trade pullbacks in the direction of the higher timeframe trend.
Long Setup Conditions
Entry
Stop Loss
Targets
Invalidation
Scenario 2: Supply / Demand Reversion
Idea
Trade failed breaks and liquidity sweeps, where price traps participants before reversing.
Long Example
Entry
After re-entry into the zone and confirmation via candle close.
Stop Loss
Below the sweep extreme (liquidity low).
Targets
👉Important Note
👉This is a counter-trend setup, so risk should be reduced compared to trend trades.
Scenario 3: Opening Range Break & Retest
Idea
Trade the OR breakout only after the market confirms acceptance of the new range.
Long Conditions
Entry
Stop Loss
Targets
Invalidation
Scenario 4: Density Break Continuation
Idea
When liquidity density is absorbed with strong momentum, the level transitions from resistance into a continuation zone.
Long Conditions
Entry
Stop Loss
In scalping, the problem is rarely that a trader doesn’t see a signal.
More often, it’s the opposite:
you see too many signals at once.
A candle moves up — you want to buy.
Price touches a zone — you want to catch a reversal.
Volume spikes — it feels like something big is about to happen.
A level breaks — your finger is already on the button.
And then the market does what it does best:
it punishes impatience and incomplete context.
Because in reality:
- A level without context is just a line.
- A volume spike without structure is just noise.
- A zone without trend understanding is just an area on a chart.
- A “setup” without alignment is still not a trade.
PRO Scalper is NOT a Signal Tool
PRO Scalper is not a buy/sell arrow machine.
It is a market map, not a signal generator.
Instead of telling you what to do, it helps you understand:
What is actually happening in the market:
- Session fair value (VWAP)
- Opening Range structure
- Supply & Demand reaction zones
- Aggressive buying/selling pressure (Delta)
- Liquidity clusters and density areas
- Higher timeframe directional bias
- Valid vs invalid scenarios
Core Idea
👉 PRO Scalper does NOT trade for you.
👉 It removes noise so you can trade with structure.
1. What is PRO Scalper
PRO Scalper is an intraday price action + liquidity framework designed for fast decision-making with context.
It combines multiple market layers into one unified view:
VWAP
- Session fair value
- Institutional reference level
Opening Range
- Early session structure
- Volatility boundaries
Trend Filter
- EMA + ADX directional bias
- Optional higher timeframe alignment
Supply / Demand Zones
- Key reaction areas
- Historical order flow response points
Delta Bubbles
- Aggressive buyer/seller pressure
- Market participation imbalance
Liquidity Densities
- Order clusters
- Magnet zones or rejection areas
Key Principle
👉 The goal is NOT visual complexity.
👉The goal is clarity of context.
Because:
- The same signal can mean completely different things depending on context.
Example:
- Bullish impulse above VWAP → continuation in trend
- Same impulse into supply after liquidity sweep → potential reversal
- Red delta in range → noise
- Red delta after OR high fake breakout → meaningful information
Final Idea
👉 PRO Scalper helps you stop reading single events — and start reading market sequences.
2. Core Execution Formula
When working with this indicator, the process should always follow a strict order:
👉Context → Level → Effort → Plan → Risk
In exactly this sequence.
Never the other way around.
A common mistake traders make is reversing the logic:
- I see a bubble → I enter → then I try to justify it
That feels fast and intuitive — but in reality, it’s expensive over time.
A correct approach looks like this:
- First, understand the broader market context
- Then identify the relevant level
- Evaluate the quality of price action (effort)
- Build a structured plan
- Only then define execution and risk
The difference is simple:
One is reacting to price. The other is trading a structured idea.
3. First Layer: VWAP
VWAP represents the average price the market has traded at during the session.
In simple terms:
👉VWAP is the intraday “fair value” reference.
When price is above VWAP, buyers are generally in control.
When price is below VWAP, sellers have the upper hand.
When price repeatedly rotates around VWAP, the market is likely balanced.
But VWAP is not a signal by itself.
It is important to avoid mechanical thinking:
- Price above VWAP does notautomatically mean buy
- Price below VWAP does not automatically mean sell
VWAP defines context, not entries.
A valid scenario might look like this:
- Price is above VWAP
- Higher timeframe trend is bullish
- Price pulls back into a demand zone
- A bullish “bubble” appears
- Candle reclaims the midpoint of the zone and closes strong
That is structured alignment — not randomness.
However, when price constantly oscillates around VWAP, breaking it both ways without follow-through, the market is likely in balance. In that environment, trend trades often fail.
👉VWAP answers a simple question: are we trading above or below intraday fair value?
4. Second Layer: Opening Range
The Opening Range defines the initial structure of the session.
In traditional markets, the first minutes or hours often set the tone for the entire day. They establish the initial balance that later expands or breaks.
In crypto, where trading is continuous, the concept still applies — we simply define a session start and observe how price behaves relative to that range.
The Opening Range can function as:
- a breakout zone
- a retest area
- a false breakout boundary
- an early target reference
- a volatility filter
For example:
Price consolidates inside the Opening Range.
Then it breaks above the range high.
A strong bullish bubble appears on the breakout.
Later, price returns to retest the OR high and holds it.
This is not just price went up.
It is a sequence of structure:
balance → breakout → retest → confirmation
But the opposite scenario is equally important:
If price breaks above the OR high, quickly falls back inside the range, and prints a bearish bubble — that can signal a failed breakout or bull trap.
👉The Opening Range answers one key question: are we expanding out of balance, or still trapped inside it?
5. Third Layer: Trend Filter
PRO Scalper includes a built-in trend filter designed to help align trades with the dominant market direction.
It can be used in three different modes:
- Off — filter disabled
- EMA — direction defined by fast/slow EMA structure
- EMA + ADX — adds trend strength confirmation
You can also combine this with higher timeframe bias, which is often just as important as any indicator setting.
This layer matters because lower timeframes are often deceptive.
What looks like a reversal on a 1–5 minute chart is frequently just a pullback within a larger higher timeframe trend.
The trend filter helps reduce this conflict by keeping you aligned with the broader structure instead of reacting to local noise.
When to use Off mode
Off mode is useful when you want full market visibility without restrictions.
You see everything:
- all liquidity sweeps
- all reactions at levels
- counter-trend opportunities
- fade / mean-reversion setups
- raw price action behavior
This mode is best for discretionary traders who prefer manual interpretation.
The trade-off is simple: more information, but also more noise.
When to use EMA mode
EMA mode is designed for directional trading.
It filters setups based on trend alignment:
- long trades only when fast EMA is above slow EMA
- short trades only when structure is bearish
This creates a cleaner environment where you are primarily trading with momentum instead of against it.
The chart becomes more selective — but also more structured.
When to use EMA + ADX mode
EMA + ADX mode is the strictest filter and is used when both direction and strength matter.
While EMA defines *direction*, ADX helps confirm whether the market is actually trending or just moving sideways.
This distinction is critical in choppy conditions where directional signals alone are unreliable.
Simple interpretation:
- EMA = where the market is going
- ADX = whether it’s worth trading it
Simple framework
- Trend Filter OFF → see everything, no restrictions
- EMA→ trade with direction
- EMA + ADX → trade only when both direction and strength agree
6. Fourth Layer: Supply & Demand Zones
Supply and demand zones are one of the core modules of PRO Scalper.
But one important misconception must be removed:
Demand zone is NOT a Buy button.
Supply zone is NOT a Sell button.
A zone is an area where price reacted before — and may react again.
Keyword: may
Not must.
👉Zones are built from pivots and adjusted using ATR. This means they adapt to volatility: wide market → wider zones; calm market → tighter zones.
There are two types:
* larger structural zones;
* faster intraday zones.
7. How to Read Zones
Zones should never be read in isolation. Their meaning always depends on context.
Instead of treating a zone as a static buy or sell area, it’s better to evaluate it through a set of structured questions.
1. Where is the zone relative to VWAP?
VWAP acts as the intraday fair value reference, so the position of a zone around it changes its behavior:
- Demand below VWAP → potential mean reversion area
- Demand above VWAP (in trend) → continuation support
- Supply above VWAP → potential target / distribution area
- Supply below VWAP (in weak market) → stronger short opportunity
VWAP helps you understand whether a zone is being traded against value or with it.
2. Is it with or against the trend?
Trend context determines the importance of the zone:
- In anuptrend, demand zones carry more weight
- In a downtrend, supply zones become more relevant
A zone aligned with trend has significantly higher probability of follow-through than one traded against structure.
3. How many times was it tested?
Every retest reduces the strength of a zone.
More touches = less liquidity left in the area.
This is where the touch counter becomes useful — it helps measure exhaustion rather than assuming all zones remain equally valid over time.
4. Is there a reaction?
A simple tap of a zone is not a reaction.
A valid reaction usually shows intent or rejection, such as:
- strong bullish or bearish bubble
- close back inside the zone
- reclaim above/below the midpoint
- false breakout / sweep behavior
- increased density or aggression
- sharp rejection with follow-through
Reaction is what gives a zone meaning — not the touch itself.
5. Where is invalidation?
If you cannot define where the idea fails, it is not a trade — it is only a hypothesis.
Every zone-based idea must have a clear invalidation point.
Without it, there is no structure, only expectation.
8. Midline Zones
The midline is the midpoint of a zone.
At first glance, it seems like a minor detail — but in practice, it often becomes a key decision area.
The midline can be used as:
- confirmation that price has truly re-entered the zone
- an intermediate target level
- a filter to avoid premature entries
- a threshold that strengthens the setup after reclaim
Example (Long setup)
- Price breaks below a Demand zone
- Then re-enters the zone
- Then closes above the midline
- A bullish bubble appears
This sequence is significantly stronger than simply reacting to the first touch of Demand.
Example (Short setup)
- Price spikes above a Supply zone
- Then returns inside the zone
- Then closes below the midline
- A bearish bubble appears
👉The logic is mirrored, but the principle is the same:
👉midline reclaim = confirmation that the market accepted the move back inside the zone
9. Delta Bubbles: What Bubbles Show
Bubbles represent a visualization of unusual pressure in the market.
A green bubble reflects buying pressure, while a red bubble reflects selling pressure. The size of the bubble indicates how strong that pressure is relative to recent price action.
It’s important to understand what this actually is — and what it is not.
This is not raw exchange order flow.
It is a proxy built from OHLCV data.
In other words, it estimates pressure based on what is visible on the chart. That makes it useful, but not absolute.
How NOT to use bubbles
A common mistake is treating bubbles as direct signals:
- green bubble → buy
- red bubble → sell
This approach is overly simplistic and usually leads to inconsistent results.
A bubble only shows effort. And effort alone does not define direction.
The same pressure can lead to very different outcomes:
- breakout continuation
- liquidity trap
- absorption by larger players
- profit-taking into strength
- stop hunts
- late-stage retail entries
Without context, the same signal can mean completely opposite things.
How to properly use bubbles
Bubbles only become meaningful when combined with structure.
They should always be read in relation to levels, context, and market location.
For example:
- Green bubble inside a Demand zone→ potential aggressive buying reaction
- Red bubble inside a Supply zone → confirmation of selling pressure
- Large bubble with no follow-through→ possible absorption or hidden counter-pressure
- Bubble on Opening Range breakout→ potential momentum confirmation
- Bubble in the middle of a range→ often just noise, low-quality signal
Core idea
A bubble is not a trade.
It is information about effort.
👉And effort only becomes meaningful when it aligns with:
👉structure → level → context → plan
👉Without that alignment, it remains just noise on the chart.
10. Liquidity Densities
Densities represent a more advanced but highly useful layer of market structure.
They highlight areas where significant activity has occurred.
This can reflect:
- elevated volume concentration
- active buyer vs seller interaction
- clustered execution zones
- potential liquidity magnets
- structural barriers or reaction zones
- areas that may be “consumed” during strong expansion
In simple terms:
👉Density shows where the market left a footprint.
👉And the market often remembers these footprints.
How price interacts with density
Price does not treat density in a single way. Its behavior depends on context:
- Sometimes density acts as support or resistance and holds price
- Sometimes it behaves like a magnet and pulls price back
- Sometimes it is fully absorbed and fuels continuation after a breakout
When high activity disappears quickly after a strong move, it can be interpreted as the area being consumed — meaning liquidity has been taken and the path is now clearer.
However, this is not a standalone signal.
If density is analyzed without context, it becomes unreliable.
But when density is broken in the direction of trend, especially near an Opening Range breakout or supported by a bubble, it becomes part of a valid scenario rather than random noise.
11. How to Set Up PRO Scalper
Now let’s go through the setup logic from a trading perspective, not just a technical checklist.
Core Settings
ATR Length
ATR is used to adapt zones and densities to market volatility.
The default value of 14 is a solid starting point.
However:
- Increase to 21 if the market is too noisy or unstable
- Decrease for faster responsiveness, but expect more sensitivity and potential false signals
There is no perfect value — it depends on market conditions and trading style.
Show Session VWAP
It is generally recommended to keep this enabled for scalping.
VWAP acts as a key intraday reference point, helping define:
- fair value
- directional bias
- balance vs imbalance conditions
Show Opening Range
This should usually be enabled for intraday trading.
The Opening Range helps you identify:
- where the initial balance formed
- where breakouts occurred
- where false moves appeared
- where retests are likely
- where price returns into prior structure
It gives context to early session movement instead of treating price as random.
OR Auto vs Manual
- Auto mode adjusts the Opening Range based on timeframe automatically
- Manual mode allows you to define a specific trading window
For crypto markets, both approaches are valid since price is continuous and traditional session structure is less rigid than in equities.
Testing both modes can help you understand which fits your strategy better.
Trend Filter
👉For Pure Trend Scalping
In strong directional markets, the goal is simple: stay with the trend and avoid countertrend noise.
Recommended setup:
- Trend Mode: EMA or EMA + ADX
- HTF (Higher Timeframe): ON
- HTF reference: 15m or 1h (for lower timeframes)
- EMA Fast / Slow: 34 / 89
- ADX: ~18–22 as a starting range
The main idea here is filtering out low-quality countertrend setups and focusing only on momentum aligned entries.
👉For Reversal Scenarios
When trading reversals, you want less filtering, more raw structure visibility.
Use:
- Trend Mode: OFF
- or EMA only (without ADX)
- “Only in trend zones”: OFF
This setup allows you to see more market interactions, including:
- liquidity sweeps
- failed breakouts
- fade reactions from key zones
Reversals are about context — not filtering everything out.
👉For Breakout Scenarios
Breakouts require confirmation, not assumptions.
Recommended:
EMA + ADX
HTF confirmation enabled
Opening Range (OR) filter
Higher bubble quantile to isolate strong impulses
This helps you focus only on high-momentum expansions, avoiding fake breakouts.
Zones
Zone Depth
Zone behavior depends heavily on depth settings:
If zones are too narrow → they get constantly violated by noise
If zones are too wide → they lose precision and become meaningless
The goal is balance: zones should reflect real reaction areas, not random micro-fluctuations.
Extend Bars
For scalping, zone extension should be limited.
- Enough to see immediate reaction
- Not so long that it clutters the chart
Overextended zones reduce readability and make structure harder to interpret.
Pair A and Pair B
Think of this as a dual-layer structure model:
- Pair A → macro / structural zones
- Pair B → micro / intraday precision levels
Practical usage:
- Pair A defines the map
- Pair B defines the entry execution
Only in Trend Zones
This filter helps clean up the chart by aligning zones with the prevailing direction.
- ON → cleaner, trend-aligned structure
- OFF → includes countertrend opportunities
Beginners benefit from keeping it ON.
Advanced traders may disable it to read full market complexity.
Bubbles
Quantile Lookback
This defines how the indicator interprets “normal vs abnormal” activity.
- 100 → very responsive, fast signals
- 200 → balanced default
- 300+ → smoother, stricter interpretation
Quantile %
Controls signal frequency:
- 80–85 → more signals, higher noise
- 90–92 → strong momentum spikes only
- 95+ → extreme, rare conditions
Recommended starting range: 85–90
Densities
Metric Selection: AbsDelta vs Volume
- AbsDelta → better for spotting aggressive order flow imbalances
- Volume → traditional approach, useful but less directional
In crypto markets, AbsDelta often provides cleaner insight into aggressive participation.
Quantile %
Higher thresholds reduce noise:
- Increase value → fewer, stronger zones
- Decrease value → more frequent signals
Adjust depending on market conditions and chart clutter.
Merge Distance
This parameter helps combine nearby density zones into one:
- Reduces visual noise
- Improves structural clarity
- Avoids over-segmentation of the same move
Break Volume Delete
If a density level is broken with strong volume, it gets removed.
Market interpretation:
The level has been fully consumed.
This helps keep only relevant, active structure on the chart.
12. Ready-Made Presets for Different Styles
These presets are starting frameworks, not fixed rules. They should always be adapted to instrument, volatility, and fees.
Preset 1: Clean Trend Scalping
Designed for directional markets with clear structure.
Suitable for:
- BTC / ETH
- Liquid futures
- Timeframes: 1m, 3m, 5m, 15m
Core Logic
Trade pullbacks in the direction of the higher timeframe trend.
Settings
- VWAP: ON
- Opening Range: ON
- Trend Filter: EMA + ADX
- HTF: ON
- HTF: 15m or 1h
- EMA: 34 / 89
- ADX: 18–22
- Only in Trend Zones: ON
- Bubbles Quantile: 85–90
- Densities Quantile: 90–92
When to Use
- Clear directional movement
- Price respecting VWAP
- Pullbacks consistently returning into zones
When NOT to Use
- Choppy VWAP environment
- No clear Opening Range breakout
- Sideways, overlapping structure with no direction
Preset 3: Opening Range Breakout
This preset is designed for trading breakouts from the initial balance range, where the market transitions from consolidation into expansion.
Logic
Wait for the Opening Range (OR) to fully form, then look for:
- breakout of OR high/low
- confirmation of momentum
- retest of the broken level before continuation
👉The key idea is not to chase the breakout, but to wait for confirmation that the market has accepted the new direction.
Settings
- Opening Range: ON
- VWAP: ON
- Trend Filter: EMA + ADX
- HTF (Higher Timeframe): ON
- Bubbles Quantile: 90
- Densities: ON
- Only in Trend Zones: ON
When to Use
- Market is transitioning from balance to expansion
- Clear impulsive breakout structure appears
- Volume and momentum confirm direction
When NOT to Use
- Breakout occurs without meaningful volume
- Price quickly returns back inside OR
- Strong opposing supply/demand zone is directly above/below OR
Preset 4: Minimal Manual Mode
This mode is built for experienced traders who prefer discretionary reading of price action over strict system filtering.
Logic
No rigid structure enforcement.
You rely on market context, price behavior, and zone interaction.
Settings
- VWAP: ON
- Opening Range: ON
- Trend Filter: OFF
- Zones: ON
- Bubbles: ON
- Densities: OFF (or only strongest levels)
- Midline: ON
- Only in Trend Zones: OFF
When to Use
- You want full market visibility
- You trade discretionally based on structure and behavior
- You combine multiple signals manually
When NOT to Use
- You struggle filtering noise
- You tend to overtrade
- You rely heavily on indicator-based confirmation
13. Trading Scenarios Using PRO Scalper
This section translates the tool into real execution logic — how setups actually form in live conditions.
Scenario 1: Trend Pullback Scalp
Idea
Trade pullbacks in the direction of the higher timeframe trend.
Long Setup Conditions
- Price is above VWAP
- Higher timeframe trend is bullish (EMA + ADX confirmation)
- ADX shows sufficient strength (if enabled)
- Price pulls back into a Demand zone
- Demand aligns with VWAP, OR level, or density area
- A green bubble appears (buy pressure)
- Candle closes above the zone midline
Entry
- On close above the midline
- or on retest of the Demand zone after confirmation
Stop Loss
- Below the Demand zone
- or below the last structural swing low
Targets
- Nearest swing high
- Opening Range High
- Next Supply zone
- Fixed R:R target
- Partial take-profit at first resistance
Invalidation
- Close below Demand zone
- VWAP is lost
- Strong opposing (red) bubble appears
- Density is broken with strong volume
Scenario 2: Supply / Demand Reversion
Idea
Trade failed breaks and liquidity sweeps, where price traps participants before reversing.
Long Example
- Price sweeps below a Demand zone
- Strong selling appears, but no continuation follows
- Price re-enters the zone
- Candle closes back above midline
- Target becomes VWAP or zone upper boundary
Entry
After re-entry into the zone and confirmation via candle close.
Stop Loss
Below the sweep extreme (liquidity low).
Targets
- Midline of the zone
- Upper boundary
- VWAP
- Opposite structural zone
👉Important Note
👉This is a counter-trend setup, so risk should be reduced compared to trend trades.
Scenario 3: Opening Range Break & Retest
Idea
Trade the OR breakout only after the market confirms acceptance of the new range.
Long Conditions
- Opening Range is established
- Price breaks OR High
- Green bubble confirms momentum
- Price retests OR High
- Retest holds
- Higher timeframe does not contradict direction
Entry
- On OR High retest
- or after confirmation candle forms
Stop Loss
- Below OR High
or below last local swing low
Targets
- Next Supply zone
- New daily high
- Fixed R:R extension
- Structural trailing exits
Invalidation
- Price returns inside OR
- Breakout lacks volume
- Strong opposing bubble appears
- VWAP is lost
Scenario 4: Density Break Continuation
Idea
When liquidity density is absorbed with strong momentum, the level transitions from resistance into a continuation zone.
Long Conditions
- A density exists above price
- Price breaks through it with strength
- Green bubble confirms buying pressure
- Price holds above breakout area
- Retest confirms support
Entry
- On confirmed hold above density
- or retest after breakout
Stop Loss
- Below broken density
- or below local swing structure
Targets - Next Supply zone
- OR High
- Previous swing highs
- VWAP extension
👉Important Note
👉Do not trade density disappearance alone.
Always confirm with: - trend context
- structure
- momentum
- volume
Scenario 5: VWAP Rotation
Idea
In balanced markets, VWAP acts as a magnet and mean reversion anchor.
Conditions - Price repeatedly returns to VWAP
- Opening Range is not clearly broken
- Trend Filter shows weak or neutral bias
- Frequent zone sweeps occur
- Mean reversion reactions are consistent
Entry - On return into zone with confirmation
- or after rejection candle forms
Stop Loss - Beyond sweep extreme
Targets - VWAP
- Zone midline
- Opposite side of OR
When NOT to Use - Strong trending conditions
- High ADX expansion phase
- Impulsive breakout away from VWAP
- Strong density breakout continuation
14. How NOT to Use PRO Scalper
This section may look secondary at first glance, but in practice it defines whether the tool becomes an edge or just another chart distraction.
Even a strong system loses value when used without discipline.
Mistake 1: Trading Every Bubble
A bubble represents effort and imbalance, not a standalone entry signal.
If every bubble becomes a trade, then: - context is ignored
- structure is ignored
- and decision-making becomes reactive instead of analytical
👉At that point, you are no longer reading the market — you are reacting to it.
Mistake 2: Buying Every Demand Zone
A Demand zone does not guarantee support. - It becomes unreliable when:
- it is old or repeatedly tested
- higher timeframe trend is bearish
- price is below VWAP
- strong density sits above price
- sellers are actively defending structure
👉A zone is not a trigger — it is a decision area, not an automatic entry.
Mistake 3: Ignoring the Higher Timeframe Trend
What looks like a reversal on a lower timeframe may simply be a pause in a higher timeframe trend.
Without HTF context, traders often: - buy pullbacks in strong downtrends
- short temporary pauses in strong uptrends
👉This is where most “perfect entries” fail — not because of timing, but because of context.
Mistake 4: Entering Without Invalidation
If you cannot clearly define when your idea is wrong, then the trade is not defined.
A stop loss should be placed where: - the setup no longer exists
- not where:
- the pain becomes emotionally uncomfortable
👉Unclear invalidation leads directly to inconsistent risk behavior.
Mistake 5: Using Identical Settings Across All Markets
Not all markets behave the same.
BTC, ETH, SOL, memecoins, and low-liquidity altcoins differ in: - volatility structure
- liquidity depth
- spread and slippage
- reaction to volume
👉A single universal setting across all instruments usually reduces performance instead of improving it.
Mistake 6: Ignoring Fees and Slippage
In scalping, execution matters as much as signal quality.
A setup can be technically correct but still unprofitable if: - targets are too small
- fees are too high
- slippage reduces edge
👉Sometimes the chart shows opportunity, while execution shows cost.
The market pays selectively — but fees are constant.
15. Risk Management
👉PRO Scalper helps identify structure and opportunity, but risk is always external to the indicator.
Before entering any trade, you should clearly know: - how much capital is at risk
- where the stop loss is placed
- where the first target is located
- what invalidates the setup
- how many trades are allowed per day
- how to behave after a losing streak
- whether fees still allow a meaningful edge
Basic Framework Example - Risk per trade: 0.25% – 1%
- Daily limit: 2–3R
- Pause after consecutive losses
- Avoid low-edge mid-range trades
- Do not average down without a defined strategy
- Avoid trades where reward does not exceed real costs
Key Principle
The indicator identifies opportunity.
Risk management decides whether you are allowed to act on it.
16. Long Checklist
Before taking a long trade, run through this structure: - Is price above VWAP?
- Is higher timeframe bias aligned?
- Has price reached Demand or OR retest?
- Is there confirmation (bubble or density reaction)?
- Did price close in the expected direction?
- Where is the invalidation level?
- Where is the first target?
- Does reward exceed risk?
- Is there nearby Supply blocking continuation?
- Does this respect daily risk limits?
If several answers are unclear, the setup is not ready.
Uncertainty is not a signal — it is a warning.
17. Short Checklist
For shorts, the structure is mirrored: - Is price below VWAP?
- Is higher timeframe bias aligned?
- Has price reached Supply or OR retest?
- Is there bearish pressure (bubble or density above)?
- Did price close below midline or structure?
- Where is invalidation?
- Where is first target?
- Is nearby Demand blocking downside?
- Is the move late or already extended?
- Is risk fully defined before entry?
👉In crypto markets, shorts often appear most attractive when longs are already trapped — this is why confirmation matters more than prediction.
18. Simple Decision Framework
You can reduce the entire system into a structured flow:
1. Context - Where is price relative to VWAP?
- What does Opening Range indicate?
- What is the higher timeframe bias?
2. Level - Has price reached Supply, Demand, OR, VWAP, or Density?
3. Effort - Is there a bubble signal?
- Is volume expanding?
- Is absorption present?
- Is there a density break?
4. Plan - Where is entry?
- Where is stop loss?
- Where is target?
- What invalidates the idea?
5. Risk - Is this trade actually worth taking?
- Or does it only look good visually?
Core Formula
Context → Level → Effort → Plan → Risk
19. Who PRO Scalper Is For
This tool is designed for traders working with structured intraday price action, especially in liquid markets.
It is most effective for: - BTC / ETH
- liquid crypto futures
- scalping and intraday trading
- pullback and retest strategies
- sweep and liquidity models
- Opening Range trading
- Supply / Demand structure
- VWAP-based rotation
- trend continuation setups
However, it is not designed for one-click trading systems.
Not for:
signal appears → enter → no further thinking
That type of approach rarely survives real market conditions.
Final Principle
👉PRO Scalper is not a shortcut.
👉It is a framework for reading structure, not replacing decision-making.
It provides a map.
The trader is responsible for navigation.
20. Final Conclusion
PRO Scalper is not an indicator that tells you buy here or sell there.
It is a structured framework designed to help you read the market in a systematic way.
Core Components
Each element has a specific role: - VWAP defines fair session value
- Opening Range defines initial market balance
- Trend Filter defines higher timeframe direction
- Supply / Demand zones define reaction areas
- Bubbles highlight abnormal effort and pressure
- Densities map liquidity and activity clusters
👉Individually, these tools are incomplete.
👉Only together do they form a coherent market structure.
The Core Idea
A strong trade does not come from a single signal.
It appears when multiple conditions align: - market context is clear
- price reaches a meaningful level
- reaction confirms interest
- entry has validation
- risk is clearly defined
- reward justifies the trade
👉Without this alignment, a “setup” is just noise inside structure.
Core Principle
The foundation of PRO Scalper can be summarized simply:
Don’t trade the signal.
Trade the scenario.
PRO Scalper provides a market map, not predictions.
The outcome is not created by the indicator itself, but by how the trader applies: - context interpretation
- structural understanding
- confirmation logic
- risk management discipline
Disclaimer
This material is provided for educational purposes only and does not constitute financial or investment advice.
Trading financial markets involves significant risk. Past behavior of price, indicators, visual zones, liquidity models, and any historical chart examples do not guarantee future results.
Before applying any strategy or trading concept, it is recommended to: - perform historical testing
- use forward (demo) testing
- trade with small position sizes
- account for fees, slippage, and liquidity conditions
- apply strict risk management at all times

Your start in algo trading badrock.capital/
A group with free signals t.me/badrockcapital
A group with free signals t.me/badrockcapital
Bài đăng liên quan
Thông báo miễn trừ trách nhiệm
Thông tin và các ấn phẩm này không nhằm mục đích, và không cấu thành, lời khuyên hoặc khuyến nghị về tài chính, đầu tư, giao dịch hay các loại khác do TradingView cung cấp hoặc xác nhận. Đọc thêm tại Điều khoản Sử dụng.
Your start in algo trading badrock.capital/
A group with free signals t.me/badrockcapital
A group with free signals t.me/badrockcapital
Bài đăng liên quan
Thông báo miễn trừ trách nhiệm
Thông tin và các ấn phẩm này không nhằm mục đích, và không cấu thành, lời khuyên hoặc khuyến nghị về tài chính, đầu tư, giao dịch hay các loại khác do TradingView cung cấp hoặc xác nhận. Đọc thêm tại Điều khoản Sử dụng.