
Hello TradingView Family / Fellow Traders,
📌on Weekly: Left Chart
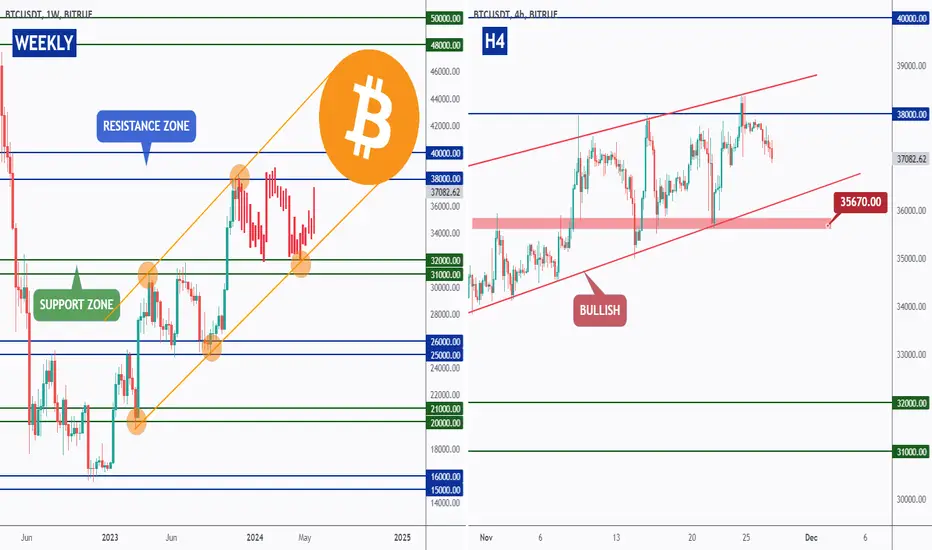
As per my last analysis, BTC is still hovering around the 38,000 - 40,000 resistance zone.
🏹 To sustain bullish control and assert dominance from a macro perspective, a crucial requirement is a weekly candle close above 40,000. Such a development would likely lead to a parabolic movement, aiming for the 50,000 resistance level.
📌on H4: Left Chart
Meanwhile, considering BTC's proximity to a resistance zone, there remains a possibility of bearish intervention, potentially pushing it back into a range reminiscent of the 30,000 to 32,000 range.
📉 To trigger the bearish scenario, a break below the last significant low in red at 35,670 is required.
📚 Always follow your trading plan regarding entry, risk management, and trade management.
Good luck!
All Strategies Are Good; If Managed Properly!
~Richard Nasr

📊I help you turn charts into a career
theSignalyst.com
Telegram
t.me/thesignalyst
Trusted Crypto Exchange
cutt.ly/qtwKuPaJ
Trusted CFD Broker
cutt.ly/TickmillReal
Trusted Crypto Prop Firm
cutt.ly/Hyrotrader
theSignalyst.com
Telegram
t.me/thesignalyst
Trusted Crypto Exchange
cutt.ly/qtwKuPaJ
Trusted CFD Broker
cutt.ly/TickmillReal
Trusted Crypto Prop Firm
cutt.ly/Hyrotrader
Thông báo miễn trừ trách nhiệm
Thông tin và các ấn phẩm này không nhằm mục đích, và không cấu thành, lời khuyên hoặc khuyến nghị về tài chính, đầu tư, giao dịch hay các loại khác do TradingView cung cấp hoặc xác nhận. Đọc thêm tại Điều khoản Sử dụng.