
Here I tried to show everything as simpliest as possible.
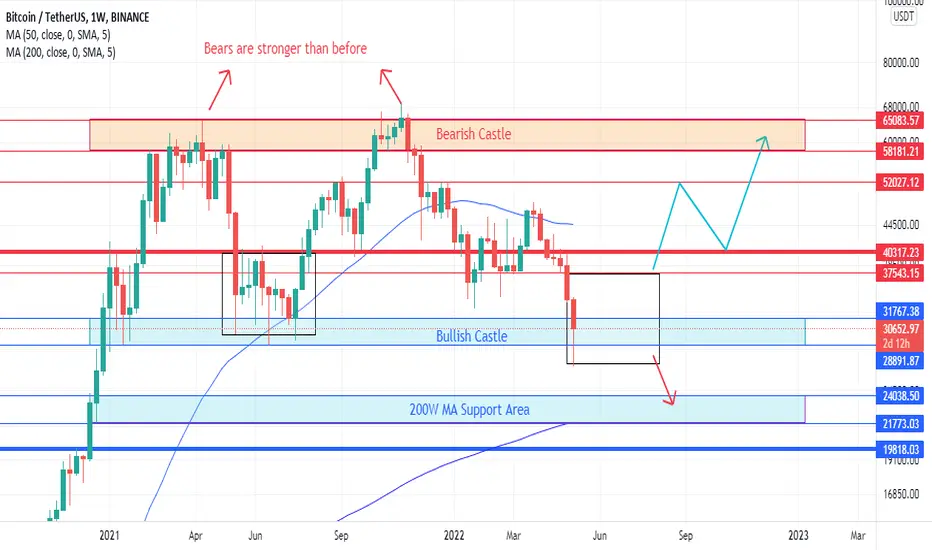
As you can see from the graph, blue lines are our support areas while the red ones are the resistances. Black boxes are the accumulation zones.
Like I written on the graph, we can see that "Bears are stronger" or "Bulls are getting weaker against to Bears" since the price rejection was faster than before when the BTC came to the area 58-65 for the second time.
I believe BTC will accumulate inside the black box for a while like it did last summer. Than, it is important to see which direction it will break. If it can break upward, 37.5-40 k area, I believe price will try the 58-65 k area again. Otherwise, if it breaks downward direction, than it can fall down until the Weekly 200 MA Support area.
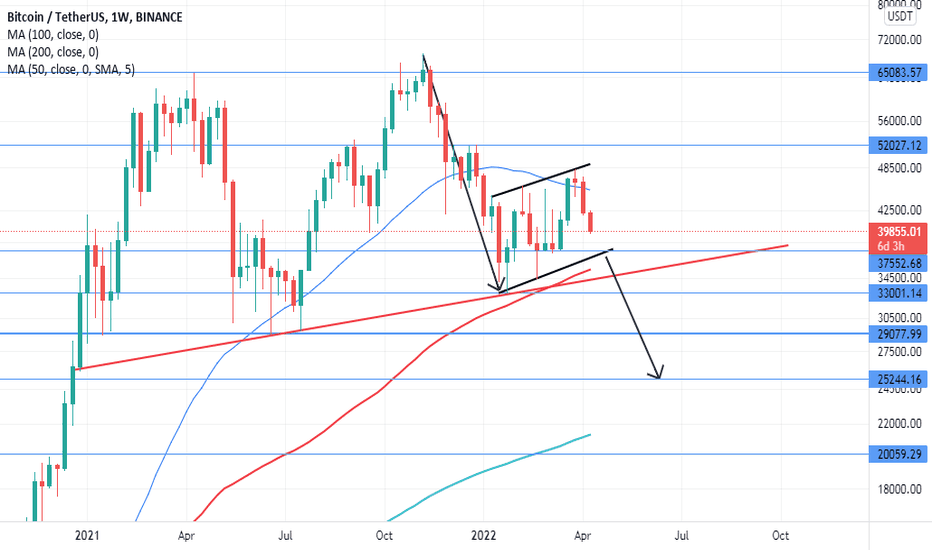
You can see my old idea below:
This is not a financial advice. This is just my analysis trial.
As you can see from the graph, blue lines are our support areas while the red ones are the resistances. Black boxes are the accumulation zones.
Like I written on the graph, we can see that "Bears are stronger" or "Bulls are getting weaker against to Bears" since the price rejection was faster than before when the BTC came to the area 58-65 for the second time.
I believe BTC will accumulate inside the black box for a while like it did last summer. Than, it is important to see which direction it will break. If it can break upward, 37.5-40 k area, I believe price will try the 58-65 k area again. Otherwise, if it breaks downward direction, than it can fall down until the Weekly 200 MA Support area.
You can see my old idea below:
This is not a financial advice. This is just my analysis trial.

Bài đăng liên quan
Thông báo miễn trừ trách nhiệm
Thông tin và các ấn phẩm này không nhằm mục đích, và không cấu thành, lời khuyên hoặc khuyến nghị về tài chính, đầu tư, giao dịch hay các loại khác do TradingView cung cấp hoặc xác nhận. Đọc thêm tại Điều khoản Sử dụng.
Bài đăng liên quan
Thông báo miễn trừ trách nhiệm
Thông tin và các ấn phẩm này không nhằm mục đích, và không cấu thành, lời khuyên hoặc khuyến nghị về tài chính, đầu tư, giao dịch hay các loại khác do TradingView cung cấp hoặc xác nhận. Đọc thêm tại Điều khoản Sử dụng.