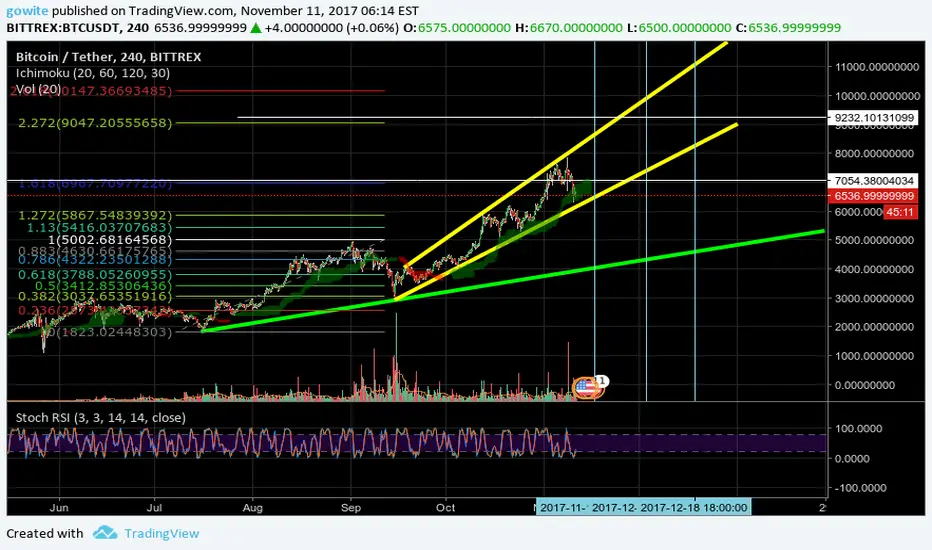
BTC followed a correction around 1.618 fib line, at least, it didn't sold under support line.
It is still in support zone. At this value, 500 usdt drops are not something huge in percentage.
The next zones that can will possibly encounter resistance are fibs 2.272-2.618 and especially 3.618.
It seems that momentum is also shaking, so it's a risky area.
If it sells under yellow support line, it can go down as more as red support line shows.
Blue lines indicate possible downtrend start days.
Remember hope for the best and prepare for the worst.
It is still in support zone. At this value, 500 usdt drops are not something huge in percentage.
The next zones that can will possibly encounter resistance are fibs 2.272-2.618 and especially 3.618.
It seems that momentum is also shaking, so it's a risky area.
If it sells under yellow support line, it can go down as more as red support line shows.
Blue lines indicate possible downtrend start days.
Remember hope for the best and prepare for the worst.

Thông báo miễn trừ trách nhiệm
Thông tin và các ấn phẩm này không nhằm mục đích, và không cấu thành, lời khuyên hoặc khuyến nghị về tài chính, đầu tư, giao dịch hay các loại khác do TradingView cung cấp hoặc xác nhận. Đọc thêm tại Điều khoản Sử dụng.
Thông báo miễn trừ trách nhiệm
Thông tin và các ấn phẩm này không nhằm mục đích, và không cấu thành, lời khuyên hoặc khuyến nghị về tài chính, đầu tư, giao dịch hay các loại khác do TradingView cung cấp hoặc xác nhận. Đọc thêm tại Điều khoản Sử dụng.