
Traders,
Bitcoin might be preparing a short squeeze. Let’s walk through the flow, structure, math, and correlations step-by-step so you understand what is happening and why it matters.
1. What Happened
Bitcoin dumped from 96k → 80.6k last week. Price then bounced and is now trading around 87k.
Under the surface:
Stablecoin-Margined Futures (USDT-M)
Since 27 Oct:
Meaning:
Interpretation:
USDT-M traders attacked the move lower aggressively. Increasing OI + dropping CVD = new sellers dominating, not buyers.
Coin-Margined Futures (BTC-M)
Since 27 Oct:
A drop in BTC-M CVD means
Interpretation:
Native BTC longs stepped aside. Short-term leverage traders pressed the downside.
Spot + Futures CVD (27 Oct → 21 Nov)
This was a clean, correlated downtrend.
2. The First Major Shift: Spot CVD Divergence
Since 21 November:
Spot CVD:
Stablecoin Futures (USDT-M):
This is the key:
Meaning:
This is one of the cleanest pre-squeeze structures you can get.
3. The Math: Fibonacci Rotation Logic

Let’s break down the structure.
(A → B → C Structure)
The retrace sits at 0.5.
This is a perfect harmonic rotation.
(X → Z → A Extension)
Fibonacci extension from X → Z → A:

Three independent mathematical signals hitting the same level. This is extremely rare and confirms the 81k zone as a rotation completion.
4. Structure Break
Since the 10 Nov low:

Interpretation:
Sellers who relied on the trendline no longer have control.
4.5 Intermarket Correlation: Why Bitcoin Dumped When ES Dumped
Another important factor:
Bitcoin dumped because ES dumped.
From 12 Nov → 21 Nov:
S&P500 (ES)
Bitcoin:
BTC acted as a ~4.5× levered version of ES.
Correlation Data:
Why?
Risk-Off Mechanics
When ES sells off:
Bitcoin didn’t dump because crypto was weak — It dumped because macro markets were risk-off.
Why this matters now
This is exactly when short squeezes start on BTC:
This is a classic intermarket correlation unwind.
5. USDT Dominance (USDT.D) Confirms Risk Rotation

USDT dominance has turned down, which means:
When USDT.D falls at the same time spot CVD rises, the market is shifting capital into crypto.
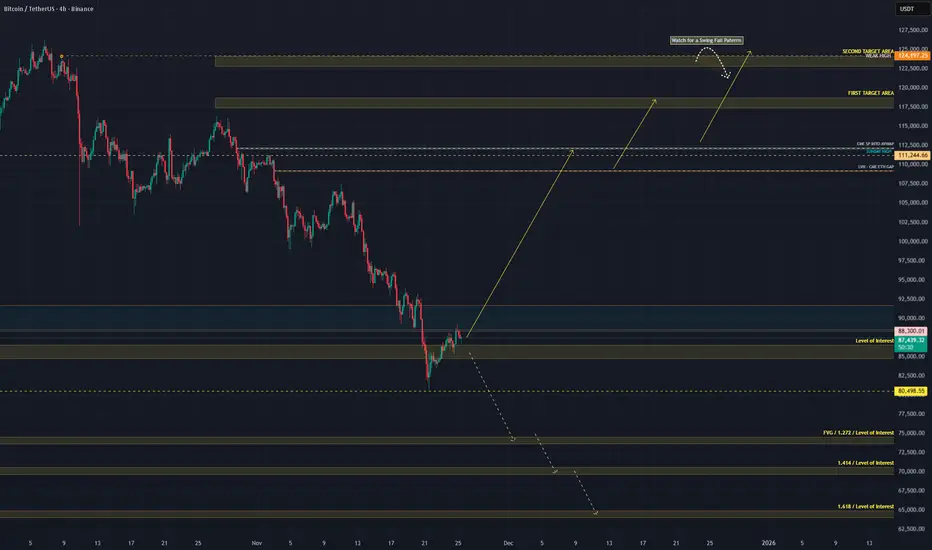
6. Targets: 118.5k → 124k
These are the next liquidity magnets.
Target #1: 118.5k
Confluences with:
Target #2: 124k
Confluences with:
Rotation Logic
7. Other Pivot Points
Marked on the chart:
Expect reaction at each point.
8. Invalidation & Bearish Pathway
My invalidation is clear:
If 80k is lost, the downside extension levels become:
These levels are:
Final View
If Bitcoin continues to hold above 80k and spot keeps leading, the squeeze toward 118.5k → 124k becomes the most likely path.
Abbreviation List
-----
If you enjoy this type of deep, data-driven breakdown—spot vs futures, CVD flow, intermarket correlation, and rotation math—drop a like and leave a comment. It helps me see whether these higher-level analyses bring value, and it motivates me to keep sharing them for free.
Bitcoin might be preparing a short squeeze. Let’s walk through the flow, structure, math, and correlations step-by-step so you understand what is happening and why it matters.
1. What Happened
Bitcoin dumped from 96k → 80.6k last week. Price then bounced and is now trading around 87k.
Under the surface:
Stablecoin-Margined Futures (USDT-M)
Since 27 Oct:
- OI increased from 225k → 280k contracts
- That’s +55k contracts (~24% increase)
- CVD went down, not up
Meaning:
- These new positions were mostly shorts
- The market added leveraged short exposure during the dump
Interpretation:
USDT-M traders attacked the move lower aggressively. Increasing OI + dropping CVD = new sellers dominating, not buyers.
Coin-Margined Futures (BTC-M)
Since 27 Oct:
- OI and CVD both dropped from 7.41B → 5.90B
- BTC-M is usually “higher conviction” demand
A drop in BTC-M CVD means
- Longs closing
- Capitulation
- Reduced bullish positioning
Interpretation:
Native BTC longs stepped aside. Short-term leverage traders pressed the downside.
Spot + Futures CVD (27 Oct → 21 Nov)
- Spot CVD ↓
- Futures CVD ↓
- Price ↓
- All making lower lows and lower highs
This was a clean, correlated downtrend.
2. The First Major Shift: Spot CVD Divergence
Since 21 November:
Spot CVD:
- Higher highs
- Higher lows
- Rising together with price
- Indicates real demand stepping in
Stablecoin Futures (USDT-M):
- Still making lower lows
- Still pressing shorts
- Still fighting the spot buyers
This is the key:
- Spot = real money
- Futures = leveraged speculation
- Rising spot CVD vs falling futures CVD = absorption pattern
Meaning:
- Strong hands buy
- Weak shorts keep selling
- Price rises anyway
- The pressure builds
- Shorts eventually run out
- The squeeze begins
This is one of the cleanest pre-squeeze structures you can get.
3. The Math: Fibonacci Rotation Logic
Let’s break down the structure.
(A → B → C Structure)
- A = 116k (27 Oct)
- B = 98.710
- C = 107.403 (retracement)
The retrace sits at 0.5.
- The reciprocal extension is 2.0
- The 2.0 extension lands exactly at the 21 Nov wick (~81k)
This is a perfect harmonic rotation.
(X → Z → A Extension)
- X = 06 Oct high
- Z = 18 Oct low
- A = 27 Oct high
Fibonacci extension from X → Z → A:
- 1.618 extension = 80.544
- It matches the 2.0 from the ABC structure
- It matches the 0.886 retracement on the HTF
Three independent mathematical signals hitting the same level. This is extremely rare and confirms the 81k zone as a rotation completion.
4. Structure Break
Since the 10 Nov low:
- 4H is making higher highs & higher lows
- The descending trendline from 11 Nov is broken
- Trend shifted from controlled downtrend → early reversal
- Structure now favors continuation upwards as long as higher lows hold
Interpretation:
Sellers who relied on the trendline no longer have control.
4.5 Intermarket Correlation: Why Bitcoin Dumped When ES Dumped
Another important factor:
Bitcoin dumped because ES dumped.
From 12 Nov → 21 Nov:
S&P500 (ES)
- Dropped from 6900 → 6525
- –5.43% correction
Bitcoin:
- Dropped from 107k → 80.5k
- –24.77% correction
- BTC acted as a ~4.5× levered version of ES.
BTC acted as a ~4.5× levered version of ES.
Correlation Data:
- Rolling BTC/ES correlation increased from 0.38 → 0.74
- Meaning BTC traded almost in sync with equities during the selloff
Why?
Risk-Off Mechanics
When ES sells off:
- Equity funds de-risk
- Macro algos rotate out of high beta
- Volatility spikes
- Systematic funds reduce exposure
- Crypto is treated as “high beta tech”
- BTC amplifies the move by a factor of 3–5×
Bitcoin didn’t dump because crypto was weak — It dumped because macro markets were risk-off.
Why this matters now
- ES has stabilized
- BTC stopped following ES lower
- Spot demand started rising
- BTC/ES correlation is dropping again (from 0.78 → ~0.55)
- USDT-M shorts didn’t adjust
This is exactly when short squeezes start on BTC:
- Macro stabilizes
- Crypto regains independence
- Shorts remain positioned for risk-off
- Spot buyers take control
- Price accelerates upward
This is a classic intermarket correlation unwind.
5. USDT Dominance (USDT.D) Confirms Risk Rotation
USDT dominance has turned down, which means:
- Traders are deploying capital
- Less stablecoin sitting idle
- More risk-on appetite
- Historically aligns with BTC beginning new legs up after HTF rotations
When USDT.D falls at the same time spot CVD rises, the market is shifting capital into crypto.
6. Targets: 118.5k → 124k
These are the next liquidity magnets.
Target #1: 118.5k
Confluences with:
- 1.141 extension of the 11 Nov → 12 Nov move
- First major liquidity pool
- First real “decision point” for the market
Target #2: 124k
Confluences with:
- A weak high that will be swept
- 1.618 extension of the same 11→12 Nov move
- Natural squeeze exhaustion zone
- Perfect location for a Swing Fail Pattern
Rotation Logic
- Shallow retraces → larger extensions (1.618 → 2.0)
- Deep retraces → smaller extensions (1.272 → 1.414)
- BTC currently fits the shallow retrace profile → favors strong extension
7. Other Pivot Points
Marked on the chart:
- Minor LVNs
- Minor-imbalances
- CME Gaps
Expect reaction at each point.
8. Invalidation & Bearish Pathway
My invalidation is clear:
- Trading below 80k invalidates the squeeze setup.
- Below 80k, the absorption breaks.
If 80k is lost, the downside extension levels become:
- 74k
- 70k
- 64k
These levels are:
- The natural downside extension pathways from the 11 Nov → 21 Nov swing
- They form the mirrored rotation of the bullish structure
Final View
- We dumped because macro went risk-off
- Bitcoin amplified the ES selloff
- Shorts loaded heavily into the move
- Spot buyers stepped in first
- A clean absorption pattern formed
- Mathematical rotation completed at ~81k
- Structure flipped
- Risk metrics like USDT.D turned down
- Correlation with ES is now unwinding
If Bitcoin continues to hold above 80k and spot keeps leading, the squeeze toward 118.5k → 124k becomes the most likely path.
Abbreviation List
- BTC – Bitcoin
- ES – S&P500 E-Mini Futures
- OI – Open Interest
- CVD – Cumulative Volume Delta
- USDT-M – Stablecoin-Margined Futures
- BTC-M – Coin-Margined Futures
- HTF – Higher Timeframe
- LVN – Low Volume Node
- AVWAP – Anchored Volume-Weighted Average Price
- PRZ – Potential Reversal Zone
- SFP – Swing Fail Pattern
- Fib – Fibonacci
- CTA – Commodity Trading Advisor (systematic trend-following funds)
- VIX – Volatility Index
- Beta – Sensitivity of an asset’s movement relative to a benchmark
- Risk-Off – Market environment where investors reduce exposure to risky assets
- Risk-On – Market environment where investors increase exposure to risky assets
-----
If you enjoy this type of deep, data-driven breakdown—spot vs futures, CVD flow, intermarket correlation, and rotation math—drop a like and leave a comment. It helps me see whether these higher-level analyses bring value, and it motivates me to keep sharing them for free.
Ghi chú
Order Flow Data:ibb.co/Z642YLNm
ibb.co/prLWKp63
Ghi chú
Another key signal:Aggregated funding across all perp exchanges flipped heavily negative after the last low.
This almost never happens.
Why it matters
-> Shorts are paying big to stay short
-> Longs are getting paid to hold
-> Market is heavily skewed short
This usually happens at or near bottoms, not tops
When funding nukes this hard while price stabilizes, BTC has almost always squeezed upward afterward (2021, 2023, even the COVID crash).
-> Deep negative funding + rising spot demand = Classic pre-squeeze conditions.
Ghi chú
Price broke out of the local structure. 91930$ is the next important level to watch.
Giao dịch được đóng thủ công
I closed all my long positions. Economic events around the world might take SP500 and equities lower, which will take Crypto down as well. Be Cautious. 
Bài đăng liên quan
Thông báo miễn trừ trách nhiệm
Thông tin và các ấn phẩm này không nhằm mục đích, và không cấu thành, lời khuyên hoặc khuyến nghị về tài chính, đầu tư, giao dịch hay các loại khác do TradingView cung cấp hoặc xác nhận. Đọc thêm tại Điều khoản Sử dụng.
Bài đăng liên quan
Thông báo miễn trừ trách nhiệm
Thông tin và các ấn phẩm này không nhằm mục đích, và không cấu thành, lời khuyên hoặc khuyến nghị về tài chính, đầu tư, giao dịch hay các loại khác do TradingView cung cấp hoặc xác nhận. Đọc thêm tại Điều khoản Sử dụng.