
More exclusive indicators from BigBeluga
Subscribe to BigBeluga Premium for $66.47/month to get exclusive indicators by this author. You pay right on TradingView and can use them on your charts straight away.
Explore BigBeluga PremiumRound Numbers: Magic Levels or Myth?
Difficulty: Intermediate
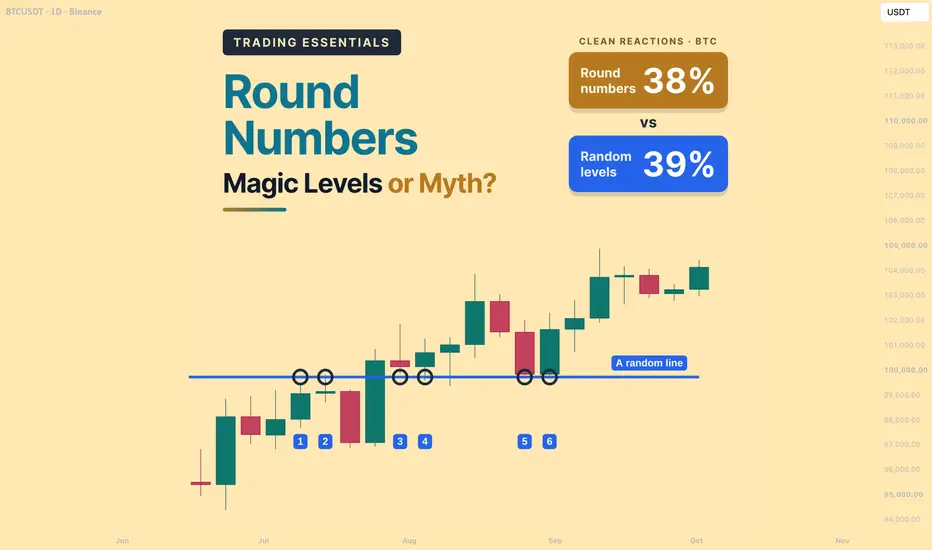
"Watch 100K — it's a psychological level." Few ideas in trading are repeated as often as this one. Round numbers are said to attract orders, stop rallies and catch falling prices. But if that were true, round numbers should hold more often than any other line drawn on the chart. This lesson puts that claim to a simple test on two years of BTC daily data — and the result is not what most traders expect.

BTC on the daily chart, November 2024 – October 2026. The gold lines sit on round numbers: 60,000, 70,000, 80,000 and so on, up to 120,000. The blue lines sit on random levels — each one 3,700 above a round number. Before reading the results, try to guess which group price respected more.
🔵 WHY TRADERS BELIEVE IN ROUND NUMBERS
The argument behind round numbers makes intuitive sense:
- People think in round numbers — targets, alerts and limit orders are often placed at 100,000 rather than 99,640
- Orders cluster — if many orders sit at the same price, that level may absorb buying or selling pressure
- Media attention — a level like 100K becomes a headline, which can draw even more attention to it
None of this is unreasonable. The question is whether it shows up in price often enough to make a difference.
🔵 WHAT COUNTS AS A "CLEAN REACTION"
To compare levels fairly, every test was judged with the same strict rules:
- Test — a daily high or low comes within 0.4% of the level from the other side
- Clean reaction — the wick does not go more than 1% through the level, no daily candle closes beyond it, and price then moves at least 3% away
- Everything else — breaks, closes through the level, or choppy back-and-forth do not count
The green circles on the charts below mark only clean reactions.
🔵 THE FAMOUS CASE: 100K

BTC on the daily chart, November 2024 – February 2025. Price tested 100,000 23 times in this window. Only 9 of those tests were clean reactions. The rest were breaks, closes through the level, or choppy trading around it.
At first glance, 100K looks important — price kept coming back to it. But "price kept coming back" is not the same as "the level held". Most of the time, price simply traded through it.
🔵 WHEN THE ROUND NUMBER DID ITS JOB

BTC on the daily chart, May–July 2025. On May 8, BTC closed at 103,228, above 100,000. Over the next two months, price dipped back toward the level twice — on June 5 and June 22 — and no daily candle closed below 100,000. The old resistance acted as support, and BTC traded above 116,000 by July 10.
Examples like this are where the belief in round numbers comes from. They are real, and they are memorable. But a few memorable examples are not the same as evidence.
🔵 THE SAME BEHAVIOR AT A RANDOM LEVEL

BTC on the daily chart, April 2026. The level 73,700 has no special meaning — it is simply a round number plus 3,700. Price tested it 7 times in this window, and 6 of those tests were clean reactions: twice as resistance on April 10 and 11, then — after a break on April 13 — four times as support between April 14 and April 20.
Nobody posts "watch 73,700" on social media. Yet price behaved there exactly the way traders describe "psychological" levels: resistance first, then support. This is the key point: the market reacts at many levels, not only at the ones we expect.
🔵 THE TEST: ROUND LINES VS RANDOM LINES

All round numbers from 60,000 to 120,000, November 2024 – October 2026. 156 tests, 59 clean reactions — about 38%.

All random levels, each 3,700 above a round number, over the same period. 175 tests, 68 clean reactions — about 39%.
The round numbers did not do better — in fact, they did very slightly worse. The test was then repeated with the grid shifted in steps of 500: 20 different sets of lines in total. The round-number grid finished 11th out of 20 — exactly in the middle. Ten arbitrary grids did better.
🐳 Pro Tip: Any horizontal line in a choppy market tends to look like support or resistance. Before trusting a level, ask whether a random line nearby would have done just as well.
🔵 WHAT ABOUT 100K ITSELF?
To be fair, 100,000 did a little better than the round-number average: over the full two years, 15 of its 34 tests were clean reactions, about 44%. But 83,700 — a random level — also reached about 44%, and 93,700 about 40%. In this sample, the most famous number on the chart behaved like an ordinary line.
One more check: if traders front-run round numbers, swing highs should cluster just below them and swing lows just above them. Across the daily swing highs and lows in this period, no such clustering appeared.
🔵 SO WHAT ACTUALLY MAKES A LEVEL MATTER?
The data does not say levels are useless. It says that a number being round is not, on its own, a reason to expect a reaction. What tends to matter more:
- Price history — a level where price clearly turned before, ideally more than once
- Volume — a level where a lot of trading took place, as covered in the volume lesson
- Structure — a level that defines the last higher low or lower high of a trend
- Context — the trend, volatility and timeframe in which the level appears
When a round number lines up with one of these, it can be a useful reference. When it does not, it is just another line.
🔵 HOW TO USE ROUND NUMBERS SENSIBLY
- As a reference, not a signal — note the level, but wait for price to show a reaction
- With a zone, not a line — reactions often happen before or after the exact number
- With a buffer for stops — avoid placing stops exactly at a round number, where many other stops may sit
- With confirmation — a close back above or below the level tells you more than the touch itself
🔵 COMMON MISTAKES TO AVOID
- Assuming a level is likely to hold because the number is round
- Remembering the reactions and forgetting the breaks
- Drawing conclusions from one famous example
- Placing entries or stops exactly on the round number
- Ignoring the price history, volume and structure around the level
🐳 PRO TIPS
- When you hear "this is a key level", check how often it actually held on your chart
- Compare any level you like with a random line nearby; if both behave the same, the level adds little
- Keep a simple log of tests and outcomes at your favorite levels — your own data is worth more than any rule of thumb
- Treat this result as specific to BTC on the daily chart over this period; other markets and timeframes may behave differently
The idea of psychological levels is attractive because it is simple and easy to remember. The data suggests the market is less impressed by round numbers than traders are. Do you still watch round numbers in your trading? Share your view in the comments.
Trading Essentials Series
MACD: Reading Momentum the Right Way
Chart Patterns: Reading the Shape of Price
Moving Averages: Choosing the Right One
RSI: Reading Momentum Beyond 70 and 30
Support & Resistance: Drawing Levels That Matter
Confluence: When Signals Line Up
Volume Analysis: The Fuel Behind Every Move
ATR Stops: Where Your Trade Is Wrong
VWAP: The Average Price That Matters
Expectancy: Is Your Win Rate Lying?
Best Regards, BigBeluga 🐳
Difficulty: Intermediate
"Watch 100K — it's a psychological level." Few ideas in trading are repeated as often as this one. Round numbers are said to attract orders, stop rallies and catch falling prices. But if that were true, round numbers should hold more often than any other line drawn on the chart. This lesson puts that claim to a simple test on two years of BTC daily data — and the result is not what most traders expect.
BTC on the daily chart, November 2024 – October 2026. The gold lines sit on round numbers: 60,000, 70,000, 80,000 and so on, up to 120,000. The blue lines sit on random levels — each one 3,700 above a round number. Before reading the results, try to guess which group price respected more.
🔵 WHY TRADERS BELIEVE IN ROUND NUMBERS
The argument behind round numbers makes intuitive sense:
- People think in round numbers — targets, alerts and limit orders are often placed at 100,000 rather than 99,640
- Orders cluster — if many orders sit at the same price, that level may absorb buying or selling pressure
- Media attention — a level like 100K becomes a headline, which can draw even more attention to it
None of this is unreasonable. The question is whether it shows up in price often enough to make a difference.
🔵 WHAT COUNTS AS A "CLEAN REACTION"
To compare levels fairly, every test was judged with the same strict rules:
- Test — a daily high or low comes within 0.4% of the level from the other side
- Clean reaction — the wick does not go more than 1% through the level, no daily candle closes beyond it, and price then moves at least 3% away
- Everything else — breaks, closes through the level, or choppy back-and-forth do not count
The green circles on the charts below mark only clean reactions.
🔵 THE FAMOUS CASE: 100K
BTC on the daily chart, November 2024 – February 2025. Price tested 100,000 23 times in this window. Only 9 of those tests were clean reactions. The rest were breaks, closes through the level, or choppy trading around it.
At first glance, 100K looks important — price kept coming back to it. But "price kept coming back" is not the same as "the level held". Most of the time, price simply traded through it.
🔵 WHEN THE ROUND NUMBER DID ITS JOB
BTC on the daily chart, May–July 2025. On May 8, BTC closed at 103,228, above 100,000. Over the next two months, price dipped back toward the level twice — on June 5 and June 22 — and no daily candle closed below 100,000. The old resistance acted as support, and BTC traded above 116,000 by July 10.
Examples like this are where the belief in round numbers comes from. They are real, and they are memorable. But a few memorable examples are not the same as evidence.
🔵 THE SAME BEHAVIOR AT A RANDOM LEVEL
BTC on the daily chart, April 2026. The level 73,700 has no special meaning — it is simply a round number plus 3,700. Price tested it 7 times in this window, and 6 of those tests were clean reactions: twice as resistance on April 10 and 11, then — after a break on April 13 — four times as support between April 14 and April 20.
Nobody posts "watch 73,700" on social media. Yet price behaved there exactly the way traders describe "psychological" levels: resistance first, then support. This is the key point: the market reacts at many levels, not only at the ones we expect.
🔵 THE TEST: ROUND LINES VS RANDOM LINES
All round numbers from 60,000 to 120,000, November 2024 – October 2026. 156 tests, 59 clean reactions — about 38%.
All random levels, each 3,700 above a round number, over the same period. 175 tests, 68 clean reactions — about 39%.
The round numbers did not do better — in fact, they did very slightly worse. The test was then repeated with the grid shifted in steps of 500: 20 different sets of lines in total. The round-number grid finished 11th out of 20 — exactly in the middle. Ten arbitrary grids did better.
🐳 Pro Tip: Any horizontal line in a choppy market tends to look like support or resistance. Before trusting a level, ask whether a random line nearby would have done just as well.
🔵 WHAT ABOUT 100K ITSELF?
To be fair, 100,000 did a little better than the round-number average: over the full two years, 15 of its 34 tests were clean reactions, about 44%. But 83,700 — a random level — also reached about 44%, and 93,700 about 40%. In this sample, the most famous number on the chart behaved like an ordinary line.
One more check: if traders front-run round numbers, swing highs should cluster just below them and swing lows just above them. Across the daily swing highs and lows in this period, no such clustering appeared.
🔵 SO WHAT ACTUALLY MAKES A LEVEL MATTER?
The data does not say levels are useless. It says that a number being round is not, on its own, a reason to expect a reaction. What tends to matter more:
- Price history — a level where price clearly turned before, ideally more than once
- Volume — a level where a lot of trading took place, as covered in the volume lesson
- Structure — a level that defines the last higher low or lower high of a trend
- Context — the trend, volatility and timeframe in which the level appears
When a round number lines up with one of these, it can be a useful reference. When it does not, it is just another line.
🔵 HOW TO USE ROUND NUMBERS SENSIBLY
- As a reference, not a signal — note the level, but wait for price to show a reaction
- With a zone, not a line — reactions often happen before or after the exact number
- With a buffer for stops — avoid placing stops exactly at a round number, where many other stops may sit
- With confirmation — a close back above or below the level tells you more than the touch itself
🔵 COMMON MISTAKES TO AVOID
- Assuming a level is likely to hold because the number is round
- Remembering the reactions and forgetting the breaks
- Drawing conclusions from one famous example
- Placing entries or stops exactly on the round number
- Ignoring the price history, volume and structure around the level
🐳 PRO TIPS
- When you hear "this is a key level", check how often it actually held on your chart
- Compare any level you like with a random line nearby; if both behave the same, the level adds little
- Keep a simple log of tests and outcomes at your favorite levels — your own data is worth more than any rule of thumb
- Treat this result as specific to BTC on the daily chart over this period; other markets and timeframes may behave differently
The idea of psychological levels is attractive because it is simple and easy to remember. The data suggests the market is less impressed by round numbers than traders are. Do you still watch round numbers in your trading? Share your view in the comments.
Trading Essentials Series
MACD: Reading Momentum the Right Way
Chart Patterns: Reading the Shape of Price
Moving Averages: Choosing the Right One
RSI: Reading Momentum Beyond 70 and 30
Support & Resistance: Drawing Levels That Matter
Confluence: When Signals Line Up
Volume Analysis: The Fuel Behind Every Move
ATR Stops: Where Your Trade Is Wrong
VWAP: The Average Price That Matters
Expectancy: Is Your Win Rate Lying?
Best Regards, BigBeluga 🐳

🌐 bigbeluga.org/tv - Get access to our powerful tools & indicators.
🔵 Learn More -> docs.bigbeluga.org/
🔵 Join Discord -> go.bigbeluga.org/k65q9bfqfu
All content provided by BigBeluga is for educational purposes only
🔵 Learn More -> docs.bigbeluga.org/
🔵 Join Discord -> go.bigbeluga.org/k65q9bfqfu
All content provided by BigBeluga is for educational purposes only
Bài đăng liên quan
Thông báo miễn trừ trách nhiệm
Thông tin và các ấn phẩm này không nhằm mục đích, và không cấu thành, lời khuyên hoặc khuyến nghị về tài chính, đầu tư, giao dịch hay các loại khác do TradingView cung cấp hoặc xác nhận. Đọc thêm tại Điều khoản Sử dụng.
🌐 bigbeluga.org/tv - Get access to our powerful tools & indicators.
🔵 Learn More -> docs.bigbeluga.org/
🔵 Join Discord -> go.bigbeluga.org/k65q9bfqfu
All content provided by BigBeluga is for educational purposes only
🔵 Learn More -> docs.bigbeluga.org/
🔵 Join Discord -> go.bigbeluga.org/k65q9bfqfu
All content provided by BigBeluga is for educational purposes only
Bài đăng liên quan
Thông báo miễn trừ trách nhiệm
Thông tin và các ấn phẩm này không nhằm mục đích, và không cấu thành, lời khuyên hoặc khuyến nghị về tài chính, đầu tư, giao dịch hay các loại khác do TradingView cung cấp hoặc xác nhận. Đọc thêm tại Điều khoản Sử dụng.