
BTC/USD
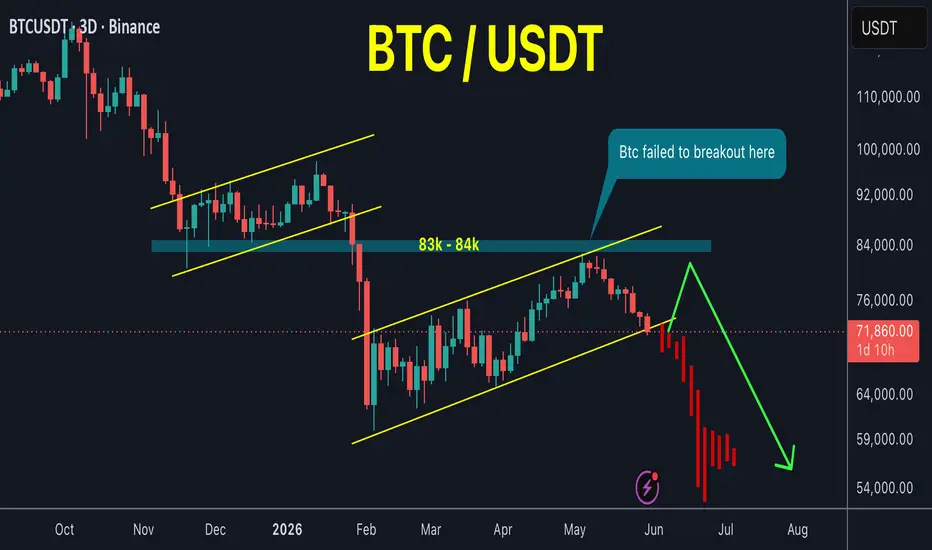
Bitcoin's price has formed another bearish flag pattern similar to the previous one.
Bitcoin has been trading within this bearish pattern for four months, and a break below it would likely lead to a price drop to a previous low or lower.
Since the top in October , the price appears to have failed to make any bullish break out, suggesting that Bitcoin will continue to decline more sooner or later until there is real trend shift in market structure
Scenario 1 and 2 both bearish now in my chart
Bitcoin's price has formed another bearish flag pattern similar to the previous one.
Bitcoin has been trading within this bearish pattern for four months, and a break below it would likely lead to a price drop to a previous low or lower.
Since the top in October , the price appears to have failed to make any bullish break out, suggesting that Bitcoin will continue to decline more sooner or later until there is real trend shift in market structure
Scenario 1 and 2 both bearish now in my chart
Giao dịch đang hoạt động
BTC just hit 68k ☑️Đóng lệnh: đạt mục tiêu
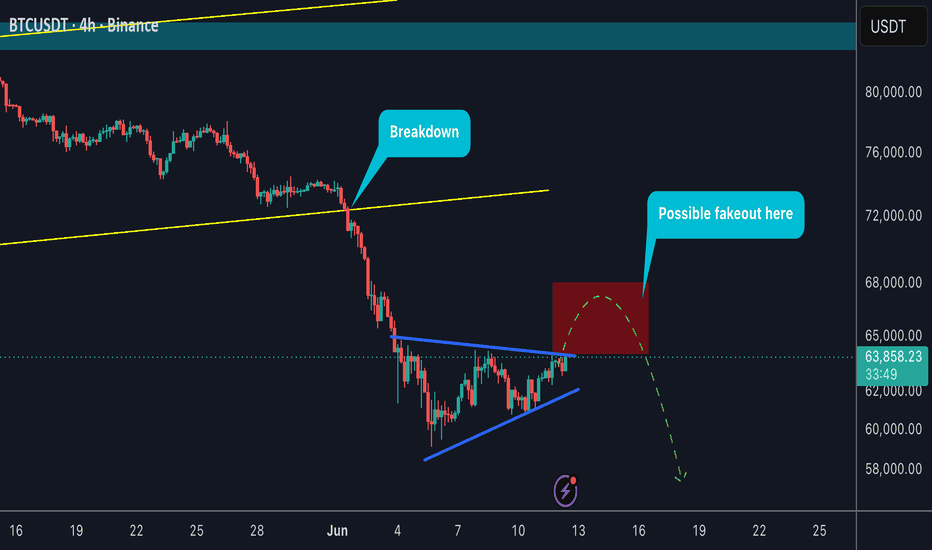
The price dropped sharply a few hours after my analysis. Ghi chú
Update :Ghi chú
Bitcoin reached $60,000 for the first time after four months of accumulation within this bearish pattern, as I predicted in my analysis.Ghi chú
New update released For full details Check here : 👇

🔷 Telegram channel: t.me/bitcoin_masters
💸☎️ For Premium Signals Group ask me here: t.me/Babenski
💸☎️ For Premium Signals Group ask me here: t.me/Babenski
Bài đăng liên quan
Thông báo miễn trừ trách nhiệm
Thông tin và các ấn phẩm này không nhằm mục đích, và không cấu thành, lời khuyên hoặc khuyến nghị về tài chính, đầu tư, giao dịch hay các loại khác do TradingView cung cấp hoặc xác nhận. Đọc thêm tại Điều khoản Sử dụng.
🔷 Telegram channel: t.me/bitcoin_masters
💸☎️ For Premium Signals Group ask me here: t.me/Babenski
💸☎️ For Premium Signals Group ask me here: t.me/Babenski
Bài đăng liên quan
Thông báo miễn trừ trách nhiệm
Thông tin và các ấn phẩm này không nhằm mục đích, và không cấu thành, lời khuyên hoặc khuyến nghị về tài chính, đầu tư, giao dịch hay các loại khác do TradingView cung cấp hoặc xác nhận. Đọc thêm tại Điều khoản Sử dụng.