
Beyond the technical setup, Bitcoin continues to be driven by macroeconomic expectations. Markets are closely watching the Federal Reserve’s interest rate outlook, with recent inflation and labor market data reinforcing expectations that rates could remain higher for longer—or even see additional tightening if inflation proves persistent. This has supported the U.S. Dollar and limited demand for risk assets. Combined with ongoing geopolitical uncertainty, Bitcoin is likely to remain volatile, making upcoming Fed commentary and economic data key catalysts for its next major move.
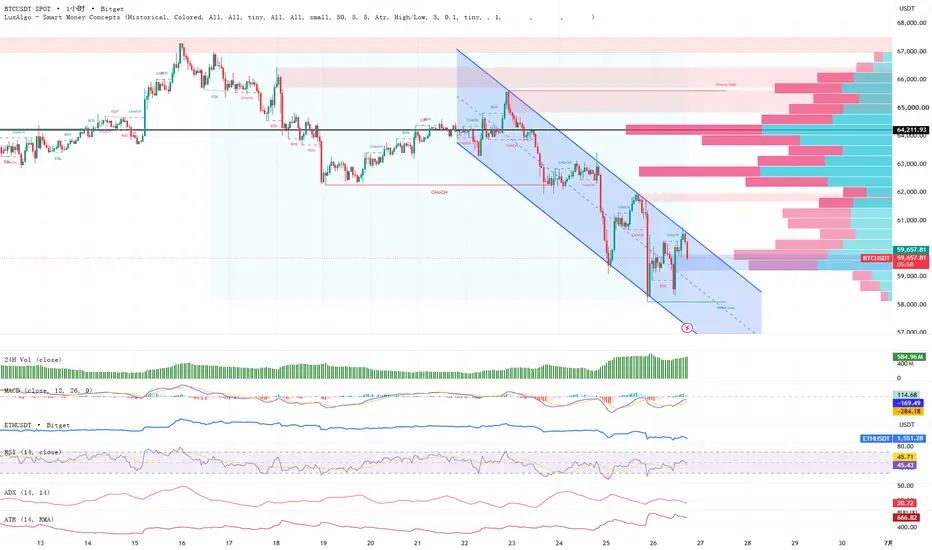
Bitcoin continues to trade inside a well-defined descending channel on the 1H chart, suggesting that the short-term trend remains bearish despite the recent rebound. After recovering sharply from the $58.3K demand zone to around $60.8K, price has once again stalled near the upper boundary of the channel, where multiple technical resistance levels are converging. The next move from here could determine whether BTC extends its correction or finally begins a larger recovery.
From a market structure perspective, the recent rally still looks like a corrective bounce rather than a confirmed trend reversal. Price has managed to reclaim part of the previous decline, but it continues to print lower highs, while the descending channel remains intact. The $60.7K–61.0K area is reinforced by the channel resistance, a previous supply zone, and a Fair Value Gap (FVG), making it a strong barrier for buyers.
Volume has improved during the recovery, but the increase appears more consistent with short covering than aggressive institutional accumulation. Unless buyers can generate a convincing breakout supported by expanding volume, the current recovery risks losing momentum.
Momentum indicators also suggest caution. The MACD has produced a bullish crossover and downside momentum is fading, but both lines remain below the zero line, indicating that the broader bearish trend has not yet been invalidated. Meanwhile, the RSI has recovered toward the neutral 45–50 region, reflecting improving momentum without confirming bullish control.
The $60,000 psychological level is now the key pivot. A rejection below this level would likely expose $59.2K first, followed by another test of the recent swing low near $58.3K. If sellers regain control there, the lower boundary of the channel around $57.5K could become the next downside target.
On the other hand, a decisive breakout above $61,000, followed by a successful retest of the channel resistance as support, would be the first meaningful signal that the short-term bearish structure is breaking. In that scenario, Bitcoin could extend its recovery toward the $61.8K–62.5K resistance zone.
Trading Idea
As long as Bitcoin remains inside the descending channel, the higher-probability approach is to trade with the trend rather than against it. Chasing longs into resistance carries unfavorable risk, while failed rallies near the upper channel boundary may continue to provide better short opportunities. Only a confirmed breakout with strong volume would shift the short-term bias back in favor of the bulls.
Key Levels
Resistance: $60.7K–61.0K → $61.8K–62.5K
Support: $60.0K → $59.2K → $58.3K → $57.5K
Bitcoin continues to trade inside a well-defined descending channel on the 1H chart, suggesting that the short-term trend remains bearish despite the recent rebound. After recovering sharply from the $58.3K demand zone to around $60.8K, price has once again stalled near the upper boundary of the channel, where multiple technical resistance levels are converging. The next move from here could determine whether BTC extends its correction or finally begins a larger recovery.
From a market structure perspective, the recent rally still looks like a corrective bounce rather than a confirmed trend reversal. Price has managed to reclaim part of the previous decline, but it continues to print lower highs, while the descending channel remains intact. The $60.7K–61.0K area is reinforced by the channel resistance, a previous supply zone, and a Fair Value Gap (FVG), making it a strong barrier for buyers.
Volume has improved during the recovery, but the increase appears more consistent with short covering than aggressive institutional accumulation. Unless buyers can generate a convincing breakout supported by expanding volume, the current recovery risks losing momentum.
Momentum indicators also suggest caution. The MACD has produced a bullish crossover and downside momentum is fading, but both lines remain below the zero line, indicating that the broader bearish trend has not yet been invalidated. Meanwhile, the RSI has recovered toward the neutral 45–50 region, reflecting improving momentum without confirming bullish control.
The $60,000 psychological level is now the key pivot. A rejection below this level would likely expose $59.2K first, followed by another test of the recent swing low near $58.3K. If sellers regain control there, the lower boundary of the channel around $57.5K could become the next downside target.
On the other hand, a decisive breakout above $61,000, followed by a successful retest of the channel resistance as support, would be the first meaningful signal that the short-term bearish structure is breaking. In that scenario, Bitcoin could extend its recovery toward the $61.8K–62.5K resistance zone.
Trading Idea
As long as Bitcoin remains inside the descending channel, the higher-probability approach is to trade with the trend rather than against it. Chasing longs into resistance carries unfavorable risk, while failed rallies near the upper channel boundary may continue to provide better short opportunities. Only a confirmed breakout with strong volume would shift the short-term bias back in favor of the bulls.
Key Levels
Resistance: $60.7K–61.0K → $61.8K–62.5K
Support: $60.0K → $59.2K → $58.3K → $57.5K

Thông báo miễn trừ trách nhiệm
Thông tin và các ấn phẩm này không nhằm mục đích, và không cấu thành, lời khuyên hoặc khuyến nghị về tài chính, đầu tư, giao dịch hay các loại khác do TradingView cung cấp hoặc xác nhận. Đọc thêm tại Điều khoản Sử dụng.
Thông báo miễn trừ trách nhiệm
Thông tin và các ấn phẩm này không nhằm mục đích, và không cấu thành, lời khuyên hoặc khuyến nghị về tài chính, đầu tư, giao dịch hay các loại khác do TradingView cung cấp hoặc xác nhận. Đọc thêm tại Điều khoản Sử dụng.