
 BTCUSDTBTCUSD
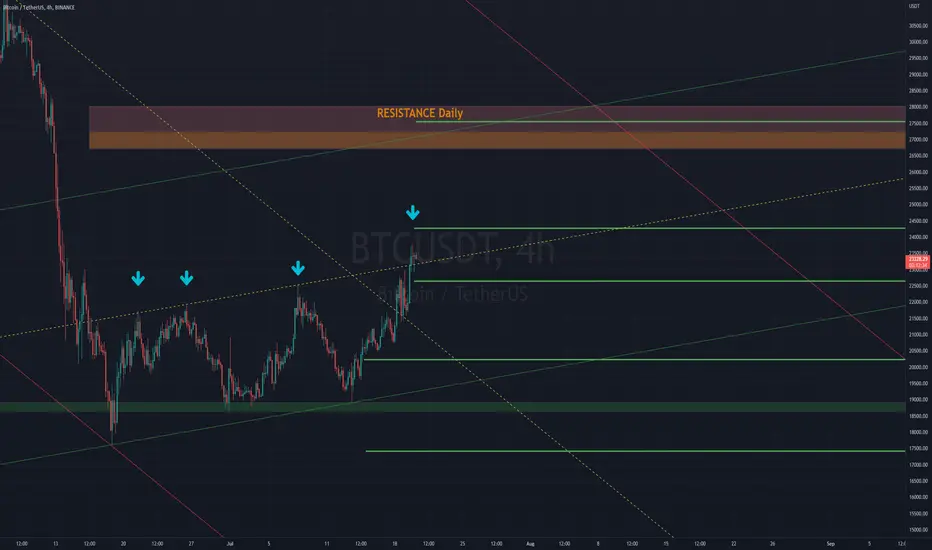
The arrows indicate every time I read a post or an article saying "Bull market is BACK Baby!!!" For a day trader, bull, bear, or sideways are irrelevant. I forecast and then wait for entries.
Bright Green lines are points where to expect a test-reject or test-retest-breakthrough. When you see the price test a Green line, it's time to switch to lower timeframes.
At the moment the Price is inching upwards in a channel created around 17th of June. But BTC is still in a long term Downward channel. It is important to pay attention to confluences.
If the price manages to break 24200, the Daily Resistance, Golden Pocket and the channels crossing is the area where I'd expect a lot of volatility.
This is my Thesis, targets are purely hypothetical based on my analysis.
This is NOT Investment and/or Trading Advice.
Happy Trades!
❤️ If you enjoy my ideas , Please like/comment , It means a lot, Thank You! ❤️
Ghi chú
An almost identical maneuver on BTC and Coinbase charts.BTC reached the levels proposed on the original chart of this idea.
Top of 24267
Bottom of 22642
Great to see that my levels thesis is holding up.

Bài đăng liên quan
Thông báo miễn trừ trách nhiệm
Thông tin và các ấn phẩm này không nhằm mục đích, và không cấu thành, lời khuyên hoặc khuyến nghị về tài chính, đầu tư, giao dịch hay các loại khác do TradingView cung cấp hoặc xác nhận. Đọc thêm tại Điều khoản Sử dụng.
Bài đăng liên quan
Thông báo miễn trừ trách nhiệm
Thông tin và các ấn phẩm này không nhằm mục đích, và không cấu thành, lời khuyên hoặc khuyến nghị về tài chính, đầu tư, giao dịch hay các loại khác do TradingView cung cấp hoặc xác nhận. Đọc thêm tại Điều khoản Sử dụng.