
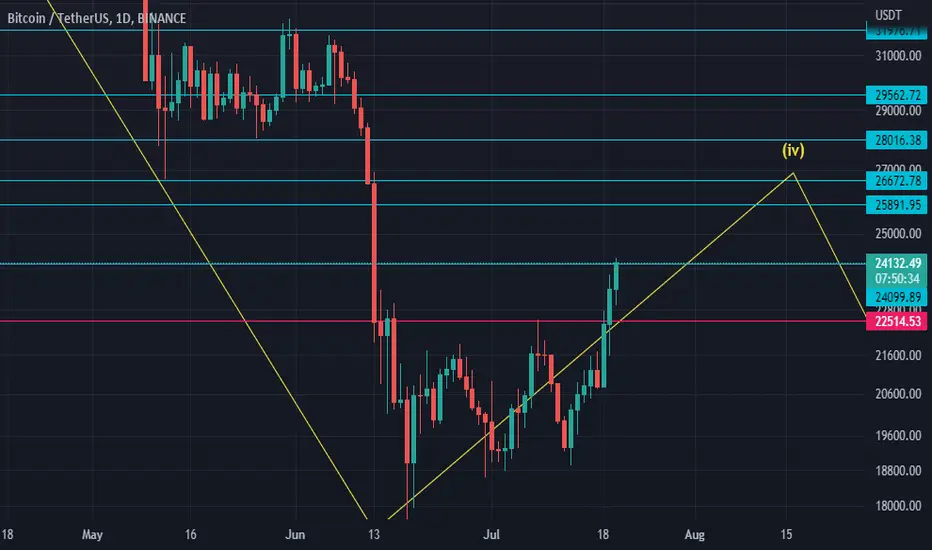
This is how I see BTC short-med-long term
as you see in the chart above I think BTC is in its 4th wave
mostly reverse around 0.38 fibo =~25700
I put other levels the price could reach
in this chart down, you can see the whole wave + the parallel channel

*
*
In this one, you can see the double-top and his target, reclaiming the nick-line is strongly bullish

*
*
there you can see USDT dominance targets and the potential reverse up to 10%

*
*
also, DXY is still bullish, as I mentioned before his targeting 112

*
conclusion, short-term bullish /mid-term bearish /long-term bullish
that could change if I saw a good move in the chart or if the price reclaimed important resistance like 28600 and 32000
I have other reasons to be bearish ( economic conditions )
boost this idea if you like it
as you see in the chart above I think BTC is in its 4th wave
mostly reverse around 0.38 fibo =~25700
I put other levels the price could reach
in this chart down, you can see the whole wave + the parallel channel
*
*
In this one, you can see the double-top and his target, reclaiming the nick-line is strongly bullish
*
*
there you can see USDT dominance targets and the potential reverse up to 10%
*
*
also, DXY is still bullish, as I mentioned before his targeting 112
*
conclusion, short-term bullish /mid-term bearish /long-term bullish
that could change if I saw a good move in the chart or if the price reclaimed important resistance like 28600 and 32000
I have other reasons to be bearish ( economic conditions )
boost this idea if you like it

Bài đăng liên quan
Thông báo miễn trừ trách nhiệm
Thông tin và các ấn phẩm này không nhằm mục đích, và không cấu thành, lời khuyên hoặc khuyến nghị về tài chính, đầu tư, giao dịch hay các loại khác do TradingView cung cấp hoặc xác nhận. Đọc thêm tại Điều khoản Sử dụng.
Bài đăng liên quan
Thông báo miễn trừ trách nhiệm
Thông tin và các ấn phẩm này không nhằm mục đích, và không cấu thành, lời khuyên hoặc khuyến nghị về tài chính, đầu tư, giao dịch hay các loại khác do TradingView cung cấp hoặc xác nhận. Đọc thêm tại Điều khoản Sử dụng.