
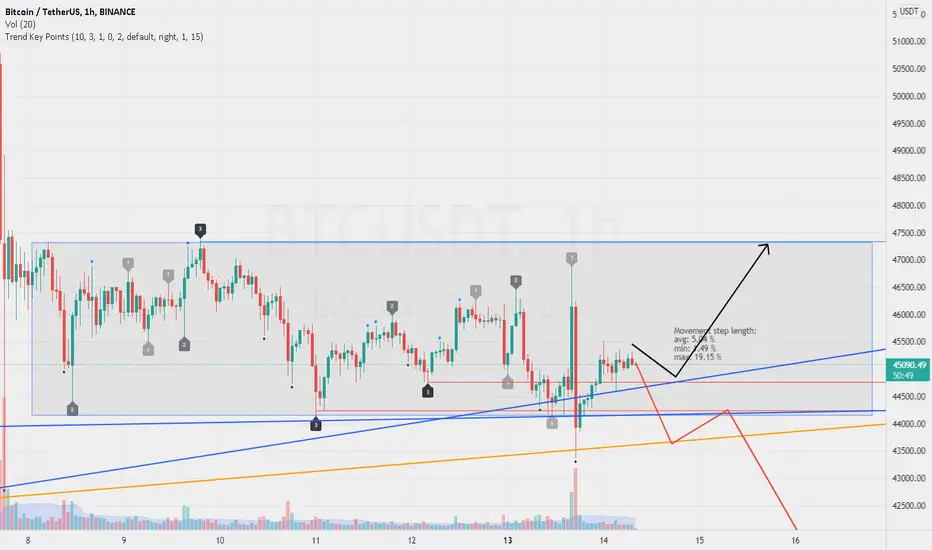
Bullish movement expected:
If the price breakdown the $44k support with a confirmation candle, the next stop will be near $41k.
Trend Key Points Indicator have been used to draw important key levels and key points.
- Momentum changed
- Also, RSI confirms the bullish movement
- Range box bottom ($44000 to $44300) is very strong support and touched early
- I could ignore the last day's pump and dump
- Strong candles not expected
If the price breakdown the $44k support with a confirmation candle, the next stop will be near $41k.
Trend Key Points Indicator have been used to draw important key levels and key points.

Thông báo miễn trừ trách nhiệm
Thông tin và các ấn phẩm này không nhằm mục đích, và không cấu thành, lời khuyên hoặc khuyến nghị về tài chính, đầu tư, giao dịch hay các loại khác do TradingView cung cấp hoặc xác nhận. Đọc thêm tại Điều khoản Sử dụng.
Thông báo miễn trừ trách nhiệm
Thông tin và các ấn phẩm này không nhằm mục đích, và không cấu thành, lời khuyên hoặc khuyến nghị về tài chính, đầu tư, giao dịch hay các loại khác do TradingView cung cấp hoặc xác nhận. Đọc thêm tại Điều khoản Sử dụng.