
This is a highly speculative post and just a hypothesis of what BTC may do based on time and price. Just an idea… for now :)
BTC has recently put in a decisive bottom around $60,800. Already, price has seen an 18% increase in less than 24 hours.
Market makers have seemingly front-run the most important structural level for BTC. Therefore, it is still possible that this level gets reached, which is why I wanted to create this predictive modeling idea.
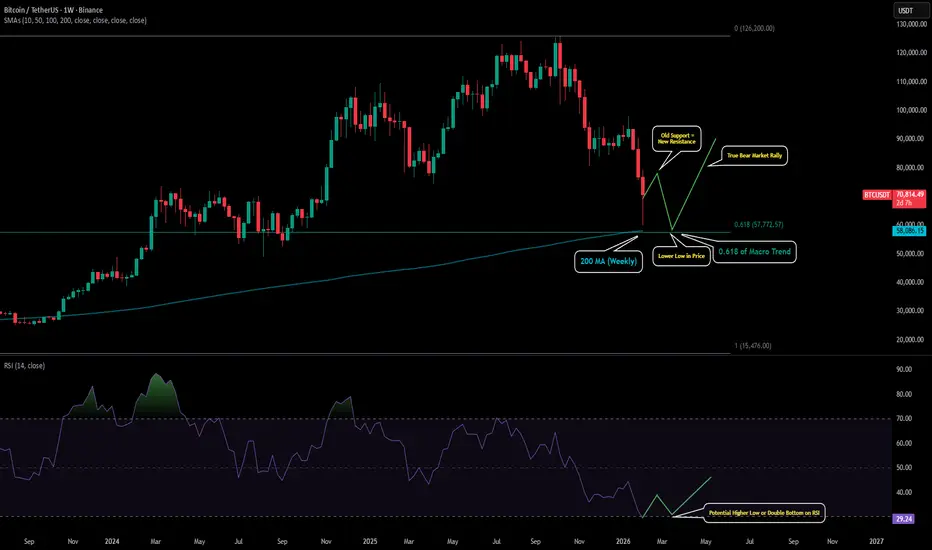
This important structural level for BTC is either around $58k or slightly below. Arguably, BTC’s most important moving average is the weekly 200 MA, which currently sits around $58,000. The other key level is the 0.618 golden ratio of the entire macro cycle (from $15.4k to $126.2k). That Fibonacci level sits just slightly below $58k, giving us a very strong double confluence—an area where algos and market makers would be eager to scoop up BTC.
If this is the case, here is how price action might develop to make that scenario a reality:
1st, BTC sees a continuation of this move and rallies toward $74,500. From there, we would expect a pivot high to form somewhere between $74,500–$80,800, with the sweet spot being around $78,500. If price creates a pivot high in this range, it would be viewed as macro old support flipping into new resistance.
2nd, sellers would take control at the pivot high and begin the next leg to the downside, bringing price back down to $58k or slightly lower, creating another lower low.
3rd, while price makes a lower low, we would expect the weekly RSI to either make an equal low (double bottom) or a higher low. This would create a weekly bullish divergence, validating strong buyer demand at the predicted price level.
Finally, price would rally off this level and fake out the market by reclaiming the old resistance zone ($74,500–$80,800) as new support, then continue higher to the next lower high between $83,400–$89,500. Another honorable mention is price simply double-topping at the new resistance level (around the price that established the first test of resistance). Either scenario would kick off the next leg of the bear market, with the series of lower lows and lower highs continuing.
BTC has recently put in a decisive bottom around $60,800. Already, price has seen an 18% increase in less than 24 hours.
Market makers have seemingly front-run the most important structural level for BTC. Therefore, it is still possible that this level gets reached, which is why I wanted to create this predictive modeling idea.
This important structural level for BTC is either around $58k or slightly below. Arguably, BTC’s most important moving average is the weekly 200 MA, which currently sits around $58,000. The other key level is the 0.618 golden ratio of the entire macro cycle (from $15.4k to $126.2k). That Fibonacci level sits just slightly below $58k, giving us a very strong double confluence—an area where algos and market makers would be eager to scoop up BTC.
If this is the case, here is how price action might develop to make that scenario a reality:
1st, BTC sees a continuation of this move and rallies toward $74,500. From there, we would expect a pivot high to form somewhere between $74,500–$80,800, with the sweet spot being around $78,500. If price creates a pivot high in this range, it would be viewed as macro old support flipping into new resistance.
2nd, sellers would take control at the pivot high and begin the next leg to the downside, bringing price back down to $58k or slightly lower, creating another lower low.
3rd, while price makes a lower low, we would expect the weekly RSI to either make an equal low (double bottom) or a higher low. This would create a weekly bullish divergence, validating strong buyer demand at the predicted price level.
Finally, price would rally off this level and fake out the market by reclaiming the old resistance zone ($74,500–$80,800) as new support, then continue higher to the next lower high between $83,400–$89,500. Another honorable mention is price simply double-topping at the new resistance level (around the price that established the first test of resistance). Either scenario would kick off the next leg of the bear market, with the series of lower lows and lower highs continuing.

Thông báo miễn trừ trách nhiệm
Thông tin và các ấn phẩm này không nhằm mục đích, và không cấu thành, lời khuyên hoặc khuyến nghị về tài chính, đầu tư, giao dịch hay các loại khác do TradingView cung cấp hoặc xác nhận. Đọc thêm tại Điều khoản Sử dụng.
Thông báo miễn trừ trách nhiệm
Thông tin và các ấn phẩm này không nhằm mục đích, và không cấu thành, lời khuyên hoặc khuyến nghị về tài chính, đầu tư, giao dịch hay các loại khác do TradingView cung cấp hoặc xác nhận. Đọc thêm tại Điều khoản Sử dụng.