
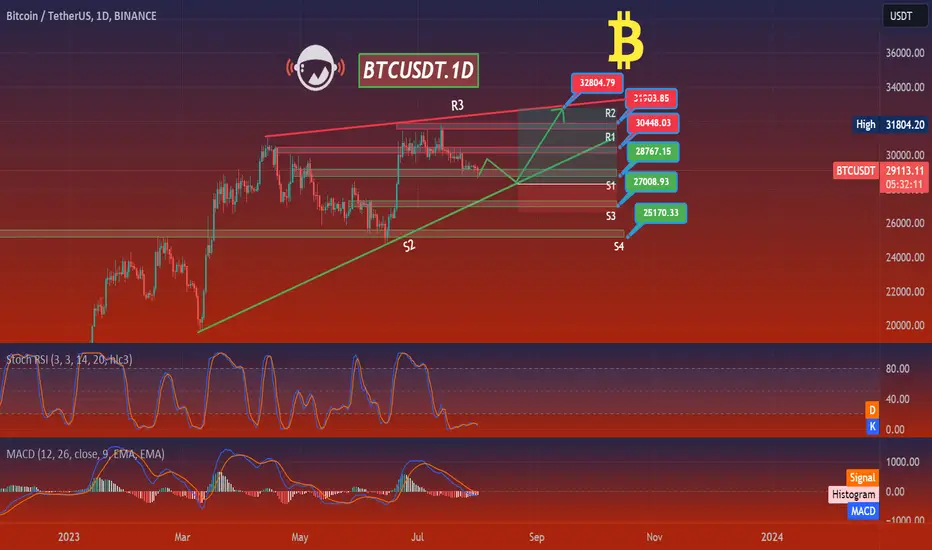
- **4-Hour Chart Analysis**
- RSI is significantly oversold at 11.35, which usually suggests a price reversal might be imminent.
- The MACD line is under the signal line with a significant negative value, suggesting strong selling pressure.
- Prices are lower than the lower Bollinger band indicating that it is oversold.
- The immediate supports are at 28742, 28158, and 27529. If the price breaches these levels, further downward movement could be expected.
- The resistances are at 30494, 31500, and 32560. An upward price movement can be expected if these levels are breached.
- **1-Day Chart Analysis**
- The RSI of 7 shows extreme oversold conditions, which could hint at an upcoming price correction.
- The MACD is also significantly negative, again suggesting strong bearish momentum.
- Prices are trading below the lower Bollinger band, which generally indicates oversold conditions.
- Supports are set at 28143, 26924, and 25156, while resistances are at 29946, 30981, and 32976.
- **7-Day Chart Analysis**
- The RSI is 62.89, indicating that the asset is neither overbought nor oversold.
- The MACD is positive, suggesting bullish momentum in the long term.
- The price is trading within the Bollinger Bands, suggesting normal trading conditions.
- Supports are set at 28671, 24796, and 21393, while resistances are at 37721, 47700, and 51608.
Overall, short-term indicators suggest extreme oversold conditions and potential for a price rebound, whereas the long-term view is more bullish.

Thông báo miễn trừ trách nhiệm
Thông tin và các ấn phẩm này không nhằm mục đích, và không cấu thành, lời khuyên hoặc khuyến nghị về tài chính, đầu tư, giao dịch hay các loại khác do TradingView cung cấp hoặc xác nhận. Đọc thêm tại Điều khoản Sử dụng.
Thông báo miễn trừ trách nhiệm
Thông tin và các ấn phẩm này không nhằm mục đích, và không cấu thành, lời khuyên hoặc khuyến nghị về tài chính, đầu tư, giao dịch hay các loại khác do TradingView cung cấp hoặc xác nhận. Đọc thêm tại Điều khoản Sử dụng.