
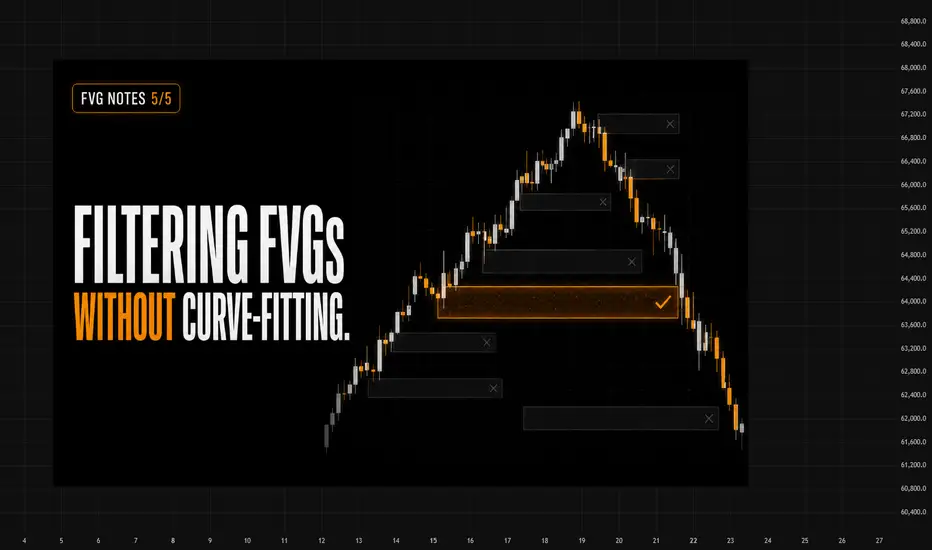
FVG Notes 5/5
The easiest way to make FVGs look powerful is to study only the examples where they worked.
That is also the easiest way to fool yourself.
After price has already reacted, every gap looks obvious. The location looks cleaner. The displacement looks more meaningful. The return looks more controlled. The response looks easier to explain.
But that is hindsight.
A useful filter has to work before the outcome is known.
The point is not to find the FVG after price reacts. The point is to decide, in real time, whether the imbalance deserves attention at all.
For me, filtering starts with formation.
Where did the FVG form? Did it appear near meaningful liquidity, a clear swing, or the edge of structure? Or did it form in the middle of unresolved price action where nothing important was being decided?
Location matters because a gap in the wrong place is usually just noise.
The second filter is displacement.
An FVG should be a record of price moving with urgency. If the move that created it was weak, overlapping, or barely different from the candles around it, the imbalance does not explain much.
A strong candle is not enough. I want to see whether the move created separation from the previous price action.
The third filter is liquidity context.
What happened before the imbalance formed?
Was a prior high or low cleared? Was one side of the market forced to react? Did the move begin after a visible area of interest was taken?
Not every useful FVG needs a perfect sweep, but it should belong to a sequence that makes sense.
The fourth filter is structure change.
Did the displacement actually change the state of the chart, or did it form inside the same unresolved range?
If the gap did not help shift structure, it may only be a small imbalance inside existing noise.
The fifth filter is cleanliness.
Some FVGs form during clean directional movement. Others appear inside choppy candles, repeated wicks, and messy overlap.
The more gaps appear in one area, the less selective each one becomes.
A chart full of boxes is not a better map. It is usually a less useful one.
After formation, the next filter is state.
Has price returned to the gap? Is it untouched, partially filled, fully filled, or still producing a readable response?
The state of an FVG changes after interaction. Treating every gap as permanently fresh is one of the fastest ways to make the chart dishonest.
A gap that has been crossed multiple times should not be treated the same as one that has never been revisited.
The final filter is behaviour.
When price reaches the area, does the interaction remain readable? Does price hesitate, reject, accept through it, or chop inside it until the original imbalance loses clarity?
This does not create a signal.
It updates the map.
That is the difference between filtering and curve-fitting.
Curve-fitting starts with the outcome and then explains why the FVG mattered.
Filtering starts before the outcome and asks whether the gap deserves attention.
Curve-fitting keeps old boxes because they looked useful once.
Filtering removes boxes when their state changes.
Curve-fitting makes every reaction look obvious after the fact.
Filtering accepts that most gaps should be ignored.
This is the whole point of the series.
An FVG is not a magic zone. It is not automatic support or resistance. It is not confirmation by itself.
It is a record of imbalance.
Some records help explain the current structure.
Most do not.
A clean process is not about marking more gaps. It is about deleting the ones that no longer help the read.
Filtering FVGs without curve-fitting means judging the gap by formation, state, and behaviour — before pretending the outcome was obvious.
The easiest way to make FVGs look powerful is to study only the examples where they worked.
That is also the easiest way to fool yourself.
After price has already reacted, every gap looks obvious. The location looks cleaner. The displacement looks more meaningful. The return looks more controlled. The response looks easier to explain.
But that is hindsight.
A useful filter has to work before the outcome is known.
The point is not to find the FVG after price reacts. The point is to decide, in real time, whether the imbalance deserves attention at all.
For me, filtering starts with formation.
Where did the FVG form? Did it appear near meaningful liquidity, a clear swing, or the edge of structure? Or did it form in the middle of unresolved price action where nothing important was being decided?
Location matters because a gap in the wrong place is usually just noise.
The second filter is displacement.
An FVG should be a record of price moving with urgency. If the move that created it was weak, overlapping, or barely different from the candles around it, the imbalance does not explain much.
A strong candle is not enough. I want to see whether the move created separation from the previous price action.
The third filter is liquidity context.
What happened before the imbalance formed?
Was a prior high or low cleared? Was one side of the market forced to react? Did the move begin after a visible area of interest was taken?
Not every useful FVG needs a perfect sweep, but it should belong to a sequence that makes sense.
The fourth filter is structure change.
Did the displacement actually change the state of the chart, or did it form inside the same unresolved range?
If the gap did not help shift structure, it may only be a small imbalance inside existing noise.
The fifth filter is cleanliness.
Some FVGs form during clean directional movement. Others appear inside choppy candles, repeated wicks, and messy overlap.
The more gaps appear in one area, the less selective each one becomes.
A chart full of boxes is not a better map. It is usually a less useful one.
After formation, the next filter is state.
Has price returned to the gap? Is it untouched, partially filled, fully filled, or still producing a readable response?
The state of an FVG changes after interaction. Treating every gap as permanently fresh is one of the fastest ways to make the chart dishonest.
A gap that has been crossed multiple times should not be treated the same as one that has never been revisited.
The final filter is behaviour.
When price reaches the area, does the interaction remain readable? Does price hesitate, reject, accept through it, or chop inside it until the original imbalance loses clarity?
This does not create a signal.
It updates the map.
That is the difference between filtering and curve-fitting.
Curve-fitting starts with the outcome and then explains why the FVG mattered.
Filtering starts before the outcome and asks whether the gap deserves attention.
Curve-fitting keeps old boxes because they looked useful once.
Filtering removes boxes when their state changes.
Curve-fitting makes every reaction look obvious after the fact.
Filtering accepts that most gaps should be ignored.
This is the whole point of the series.
An FVG is not a magic zone. It is not automatic support or resistance. It is not confirmation by itself.
It is a record of imbalance.
Some records help explain the current structure.
Most do not.
A clean process is not about marking more gaps. It is about deleting the ones that no longer help the read.
Filtering FVGs without curve-fitting means judging the gap by formation, state, and behaviour — before pretending the outcome was obvious.

SMC structure tools — no signals, just the map. Free alerts → t.me/smc_scanner_free | Scanner PRO → whop.com/smc-scanner | @EmpArchitect
Thông báo miễn trừ trách nhiệm
Thông tin và các ấn phẩm này không nhằm mục đích, và không cấu thành, lời khuyên hoặc khuyến nghị về tài chính, đầu tư, giao dịch hay các loại khác do TradingView cung cấp hoặc xác nhận. Đọc thêm tại Điều khoản Sử dụng.
SMC structure tools — no signals, just the map. Free alerts → t.me/smc_scanner_free | Scanner PRO → whop.com/smc-scanner | @EmpArchitect
Thông báo miễn trừ trách nhiệm
Thông tin và các ấn phẩm này không nhằm mục đích, và không cấu thành, lời khuyên hoặc khuyến nghị về tài chính, đầu tư, giao dịch hay các loại khác do TradingView cung cấp hoặc xác nhận. Đọc thêm tại Điều khoản Sử dụng.