
Hello everyone! This is the CryptoRobotics trader-analyst with a daily market update.
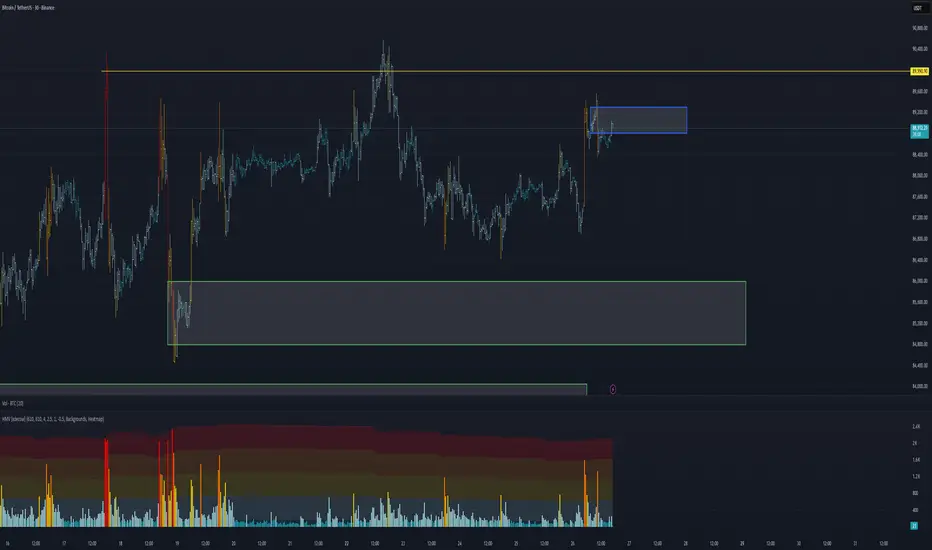
Yesterday, Bitcoin tested the technical level at $88,400, where another wave of selling emerged. However, the decline did not develop further — selling pressure was absorbed by relatively strong buying activity.
At the moment, price is attempting to consolidate above this level. From a chart perspective, buyer momentum looks solid, but cluster analysis shows that the majority of volume is concentrated higher, within the $88,800–$89,300 range.
The key focus now is how this volume zone will be realized. If the price fails to break through and sellers show active defense, a continuation of the decline toward the nearest strong support becomes likely.
If sellers remain inactive and the $88,800–$89,300 zone is broken, we expect a test of $90,000. In that case, pullbacks toward the now-mirrored support at $89,300–$88,800 can be considered for long positions.
Buy zones
$86,000–$84,800 — anomalous activity
$84,000–$82,000 — volume anomalies
Sell zones
$90,000 — local resistance
~$92,400 — local sell zone
$94,000–$97,500 — volume zone
$101,000–$104,000 — accumulated volume
This publication is not financial advice.

Unlock your potential in trading
Bài đăng liên quan
Thông báo miễn trừ trách nhiệm
Thông tin và các ấn phẩm này không nhằm mục đích, và không cấu thành, lời khuyên hoặc khuyến nghị về tài chính, đầu tư, giao dịch hay các loại khác do TradingView cung cấp hoặc xác nhận. Đọc thêm tại Điều khoản Sử dụng.
Unlock your potential in trading
Bài đăng liên quan
Thông báo miễn trừ trách nhiệm
Thông tin và các ấn phẩm này không nhằm mục đích, và không cấu thành, lời khuyên hoặc khuyến nghị về tài chính, đầu tư, giao dịch hay các loại khác do TradingView cung cấp hoặc xác nhận. Đọc thêm tại Điều khoản Sử dụng.