
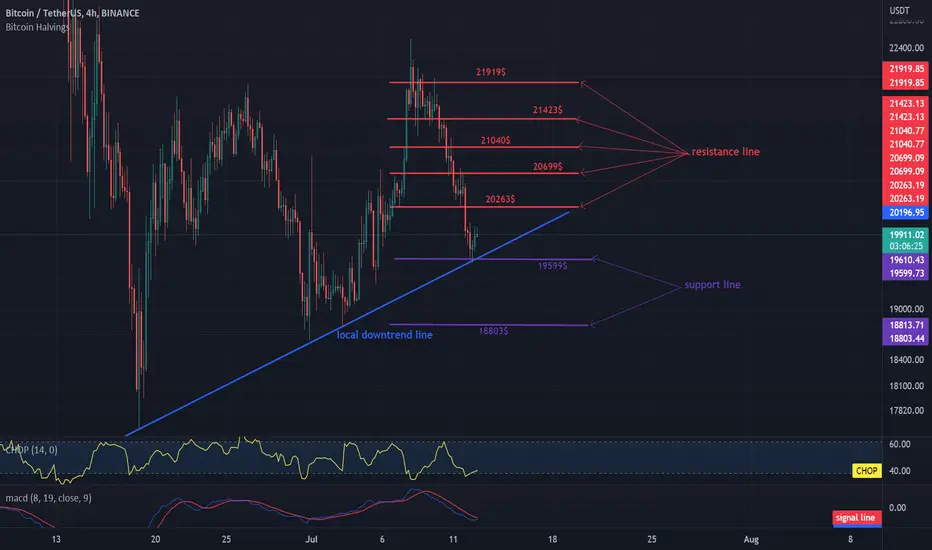
Hello everyone, let's take a look at the BTC to USDT chart over the 4 hour timeframe. As you can see, price is moving above the local uptrend line.
Let's start with the designation of the support line and as you can see the first support in the near future is $ 19,599, if the support breaks down, the next support is $ 18,803.
Now let's move from the resistance line as you can see the first resistance is $ 20,263, if you can break it the next resistance will be $ 20,699, $ 55,2,040, $ 21,423 and $ 21,919.
Looking at the CHOP indicator, we can see that in the 4-hour interval the energy has been used and the MACD indicator shows that we are continuing the local downward trend.
Let's start with the designation of the support line and as you can see the first support in the near future is $ 19,599, if the support breaks down, the next support is $ 18,803.
Now let's move from the resistance line as you can see the first resistance is $ 20,263, if you can break it the next resistance will be $ 20,699, $ 55,2,040, $ 21,423 and $ 21,919.
Looking at the CHOP indicator, we can see that in the 4-hour interval the energy has been used and the MACD indicator shows that we are continuing the local downward trend.

Thông báo miễn trừ trách nhiệm
Thông tin và các ấn phẩm này không nhằm mục đích, và không cấu thành, lời khuyên hoặc khuyến nghị về tài chính, đầu tư, giao dịch hay các loại khác do TradingView cung cấp hoặc xác nhận. Đọc thêm tại Điều khoản Sử dụng.
Thông báo miễn trừ trách nhiệm
Thông tin và các ấn phẩm này không nhằm mục đích, và không cấu thành, lời khuyên hoặc khuyến nghị về tài chính, đầu tư, giao dịch hay các loại khác do TradingView cung cấp hoặc xác nhận. Đọc thêm tại Điều khoản Sử dụng.