
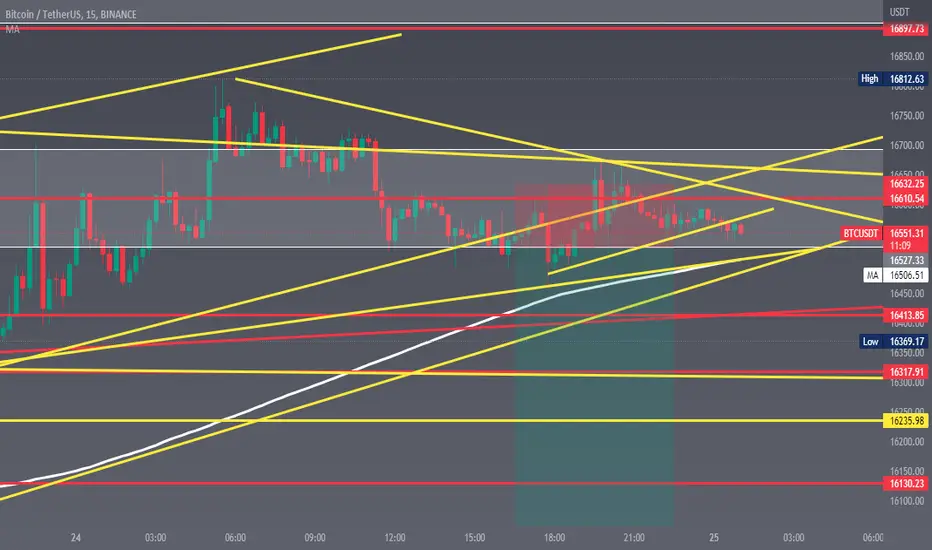
BTC New Target
Bear vs Bull
Once again we look at Bitcoin (XBT) short-term.
We have a recent bullish move... What happens next?
Above the blue and grey lines the bullish move can continue.
Immediate resistance is also found at the black line or MA200 ($16,483).
Looking at these three levels, XBT needs to move above the $16,500/$16,850 price range to knock out the bears.
Any trading below the blue line (~$16,615) can keep the bears alive and the drop resume.
If this level are conquered, then the balls passes towards the bulls.
More details on the chart.
Still red...
Namaste.

Thông báo miễn trừ trách nhiệm
Thông tin và các ấn phẩm này không nhằm mục đích, và không cấu thành, lời khuyên hoặc khuyến nghị về tài chính, đầu tư, giao dịch hay các loại khác do TradingView cung cấp hoặc xác nhận. Đọc thêm tại Điều khoản Sử dụng.
Thông báo miễn trừ trách nhiệm
Thông tin và các ấn phẩm này không nhằm mục đích, và không cấu thành, lời khuyên hoặc khuyến nghị về tài chính, đầu tư, giao dịch hay các loại khác do TradingView cung cấp hoặc xác nhận. Đọc thêm tại Điều khoản Sử dụng.