
Bitcoin Price Analysis 16-08-2022
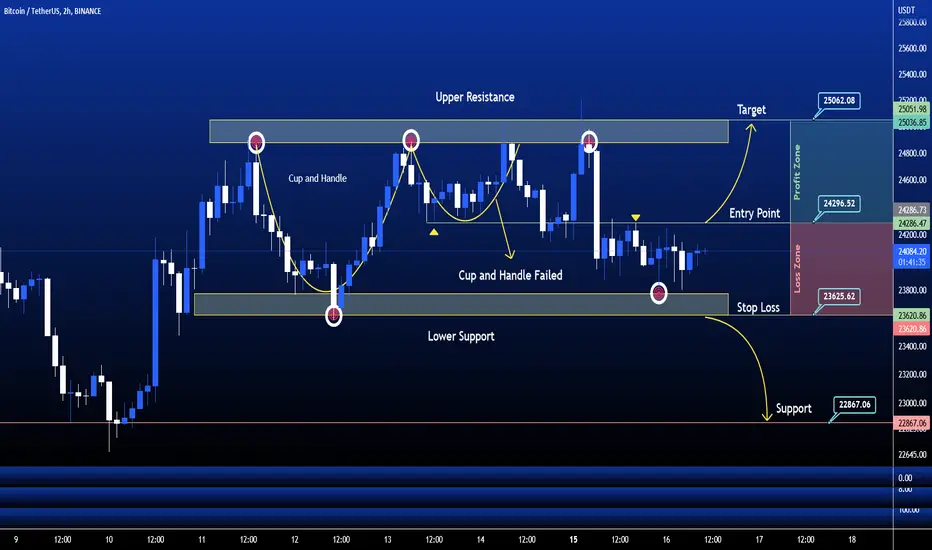
The above chart of Bitcoin (BTCUSDT) laid out the Horizontal channel pattern. Horizontal channel also known as the sideways trend. In order to indicate how the price is constrained between the upper line of resistance and lower line of support, horizontal channels are trend lines that join changeable price highs and lows.
Currently, Bitcoin (BTCUSDT) is in the range of $24065. If the pattern continues, the price of Bitcoin (BTCUSDT) might reach the resistance levels of $25060 and $0.1052. If the trend reverses, then the price of HBAR may fall to $23625.
Short Note :
Buy Level : $24300
Target : $25060
Stop Loss : $23625
Happy Trading $$$
The above chart of Bitcoin (BTCUSDT) laid out the Horizontal channel pattern. Horizontal channel also known as the sideways trend. In order to indicate how the price is constrained between the upper line of resistance and lower line of support, horizontal channels are trend lines that join changeable price highs and lows.
Currently, Bitcoin (BTCUSDT) is in the range of $24065. If the pattern continues, the price of Bitcoin (BTCUSDT) might reach the resistance levels of $25060 and $0.1052. If the trend reverses, then the price of HBAR may fall to $23625.
Short Note :
Buy Level : $24300
Target : $25060
Stop Loss : $23625
Happy Trading $$$

Bài đăng liên quan
Thông báo miễn trừ trách nhiệm
Thông tin và các ấn phẩm này không nhằm mục đích, và không cấu thành, lời khuyên hoặc khuyến nghị về tài chính, đầu tư, giao dịch hay các loại khác do TradingView cung cấp hoặc xác nhận. Đọc thêm tại Điều khoản Sử dụng.
Bài đăng liên quan
Thông báo miễn trừ trách nhiệm
Thông tin và các ấn phẩm này không nhằm mục đích, và không cấu thành, lời khuyên hoặc khuyến nghị về tài chính, đầu tư, giao dịch hay các loại khác do TradingView cung cấp hoặc xác nhận. Đọc thêm tại Điều khoản Sử dụng.