
🔍 Market Overview
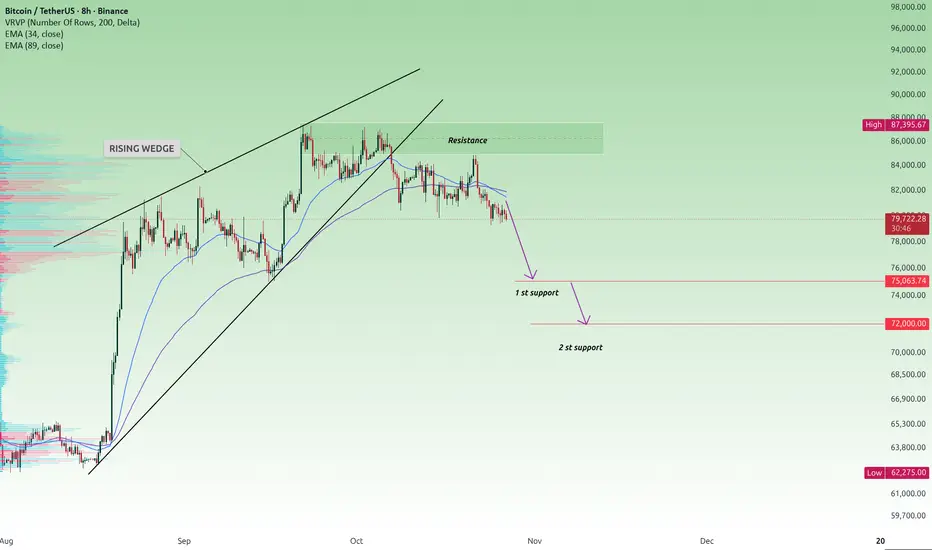
Bitcoin is trading around 79,700 on the 8H chart, and the structure has changed noticeably.
The wedge broke.
After the strong rally from the 63,000 area, BTC developed a rising wedge and eventually pushed into the 85,000–87,400 resistance zone. Buyers tested this area several times but never managed to establish a convincing breakout.
That failure mattered.
Price subsequently lost the lower boundary of the wedge and moved beneath both the EMA 34 and EMA 89. Instead of recovering quickly, BTC continued forming weaker price action underneath the moving averages, suggesting that sellers are beginning to control the short-term structure.
For now, I’m looking lower.
📉 Market Structure Insight
• Market Bias: Bearish
• Pattern: Rising Wedge Breakdown
• Momentum: Weakening below EMA 34 & EMA 89
• Major Resistance: 85,000–87,400
• Downside Targets: 75,000 / 72,000
The breakdown itself is only part of the story.
What happened afterward is more important.
BTC failed to reclaim the broken wedge structure, remained below both moving averages and continued drifting away from the major resistance zone. That sequence makes the recent weakness harder to dismiss as a simple pullback.
Buyers are losing ground.
As long as price remains below the EMA cluster and cannot recover the broken structure, rallies are more likely to face selling pressure rather than immediately restart the previous uptrend.
🚀 Preferred Setup — SELL
I would not chase every red candle from here.
Wait for structure.
A weak rebound into the EMA area followed by rejection would provide a cleaner bearish continuation setup. Alternatively, another decisive breakdown from the current consolidation could confirm that sellers are ready for the next leg lower.
The first major objective sits around 75,000.
This is important.
BTC could react there after an extended decline, so I would watch how price behaves rather than automatically expecting an immediate breakdown. But if 75,000 fails to attract meaningful demand and sellers maintain control, the next downside level comes into focus around 72,000.
🎯 Target 1: 75,000
🎯 Target 2: 72,000
⚠️ Trading Perspective
There is no need for BTC to fall in a straight line.
Markets rarely do.
Short-term rebounds can develop even inside a bearish structure, particularly after several consecutive candles lower. Those rebounds do not automatically invalidate the setup.
The location matters more.
If BTC continues trading beneath the EMA 34 and EMA 89 while failing to rebuild structure above them, I would treat recovery attempts cautiously and continue favoring the downside.
The former 85,000–87,400 resistance zone remains even more significant.
Until buyers can reclaim that area, the broader recovery has unfinished business below.
🧠 Professional Insight
The setup comes down to a simple sequence:
Rising wedge formed.
Resistance held.
Wedge support broke.
Both EMAs were lost.
Price stayed weak.
Now the downside is exposed.
The mistake would be selling simply because BTC has already dropped. A better approach is to wait for the market to offer confirmation through either a failed recovery or another structural breakdown.
No chasing.
Let price confirm.
If bearish momentum persists, 75,000 is the first area I expect the market to test. Below that, 72,000 becomes the next logical objective.
🛡️ Risk Management
• Avoid chasing an already extended bearish candle.
• Look for structural confirmation before considering an entry.
• Position the stop according to the setup’s invalidation point and volatility.
• Reduce leverage when volatility expands.
• Keep position sizing disciplined.
• Reassess the bearish thesis if BTC begins reclaiming the broken structure.
The direction is clear.
The entry still matters.
Disclaimer: This analysis is for educational purposes only and does not constitute financial or investment advice. Trading involves risk, and the outlined scenario remains conditional rather than guaranteed.
Bitcoin is trading around 79,700 on the 8H chart, and the structure has changed noticeably.
The wedge broke.
After the strong rally from the 63,000 area, BTC developed a rising wedge and eventually pushed into the 85,000–87,400 resistance zone. Buyers tested this area several times but never managed to establish a convincing breakout.
That failure mattered.
Price subsequently lost the lower boundary of the wedge and moved beneath both the EMA 34 and EMA 89. Instead of recovering quickly, BTC continued forming weaker price action underneath the moving averages, suggesting that sellers are beginning to control the short-term structure.
For now, I’m looking lower.
📉 Market Structure Insight
• Market Bias: Bearish
• Pattern: Rising Wedge Breakdown
• Momentum: Weakening below EMA 34 & EMA 89
• Major Resistance: 85,000–87,400
• Downside Targets: 75,000 / 72,000
The breakdown itself is only part of the story.
What happened afterward is more important.
BTC failed to reclaim the broken wedge structure, remained below both moving averages and continued drifting away from the major resistance zone. That sequence makes the recent weakness harder to dismiss as a simple pullback.
Buyers are losing ground.
As long as price remains below the EMA cluster and cannot recover the broken structure, rallies are more likely to face selling pressure rather than immediately restart the previous uptrend.
🚀 Preferred Setup — SELL
I would not chase every red candle from here.
Wait for structure.
A weak rebound into the EMA area followed by rejection would provide a cleaner bearish continuation setup. Alternatively, another decisive breakdown from the current consolidation could confirm that sellers are ready for the next leg lower.
The first major objective sits around 75,000.
This is important.
BTC could react there after an extended decline, so I would watch how price behaves rather than automatically expecting an immediate breakdown. But if 75,000 fails to attract meaningful demand and sellers maintain control, the next downside level comes into focus around 72,000.
🎯 Target 1: 75,000
🎯 Target 2: 72,000
⚠️ Trading Perspective
There is no need for BTC to fall in a straight line.
Markets rarely do.
Short-term rebounds can develop even inside a bearish structure, particularly after several consecutive candles lower. Those rebounds do not automatically invalidate the setup.
The location matters more.
If BTC continues trading beneath the EMA 34 and EMA 89 while failing to rebuild structure above them, I would treat recovery attempts cautiously and continue favoring the downside.
The former 85,000–87,400 resistance zone remains even more significant.
Until buyers can reclaim that area, the broader recovery has unfinished business below.
🧠 Professional Insight
The setup comes down to a simple sequence:
Rising wedge formed.
Resistance held.
Wedge support broke.
Both EMAs were lost.
Price stayed weak.
Now the downside is exposed.
The mistake would be selling simply because BTC has already dropped. A better approach is to wait for the market to offer confirmation through either a failed recovery or another structural breakdown.
No chasing.
Let price confirm.
If bearish momentum persists, 75,000 is the first area I expect the market to test. Below that, 72,000 becomes the next logical objective.
🛡️ Risk Management
• Avoid chasing an already extended bearish candle.
• Look for structural confirmation before considering an entry.
• Position the stop according to the setup’s invalidation point and volatility.
• Reduce leverage when volatility expands.
• Keep position sizing disciplined.
• Reassess the bearish thesis if BTC begins reclaiming the broken structure.
The direction is clear.
The entry still matters.
Disclaimer: This analysis is for educational purposes only and does not constitute financial or investment advice. Trading involves risk, and the outlined scenario remains conditional rather than guaranteed.

🚀 SMART CRYPTO TRADING STARTS HERE!
BTC • ETH • ALTCOINS
🎯 Daily Signals | Entry • TP • SL
⚡ Real-Time Alerts & Market Insights
💎 VIP Signals & Private Support
🔥 TRADE SMARTER. STAY AHEAD.
👇 JOIN OUR COMMUNITY
t.me/+22Cs-Z14bJg3NDJl
BTC • ETH • ALTCOINS
🎯 Daily Signals | Entry • TP • SL
⚡ Real-Time Alerts & Market Insights
💎 VIP Signals & Private Support
🔥 TRADE SMARTER. STAY AHEAD.
👇 JOIN OUR COMMUNITY
t.me/+22Cs-Z14bJg3NDJl
Bài đăng liên quan
Thông báo miễn trừ trách nhiệm
Thông tin và các ấn phẩm này không nhằm mục đích, và không cấu thành, lời khuyên hoặc khuyến nghị về tài chính, đầu tư, giao dịch hay các loại khác do TradingView cung cấp hoặc xác nhận. Đọc thêm tại Điều khoản Sử dụng.
🚀 SMART CRYPTO TRADING STARTS HERE!
BTC • ETH • ALTCOINS
🎯 Daily Signals | Entry • TP • SL
⚡ Real-Time Alerts & Market Insights
💎 VIP Signals & Private Support
🔥 TRADE SMARTER. STAY AHEAD.
👇 JOIN OUR COMMUNITY
t.me/+22Cs-Z14bJg3NDJl
BTC • ETH • ALTCOINS
🎯 Daily Signals | Entry • TP • SL
⚡ Real-Time Alerts & Market Insights
💎 VIP Signals & Private Support
🔥 TRADE SMARTER. STAY AHEAD.
👇 JOIN OUR COMMUNITY
t.me/+22Cs-Z14bJg3NDJl
Bài đăng liên quan
Thông báo miễn trừ trách nhiệm
Thông tin và các ấn phẩm này không nhằm mục đích, và không cấu thành, lời khuyên hoặc khuyến nghị về tài chính, đầu tư, giao dịch hay các loại khác do TradingView cung cấp hoặc xác nhận. Đọc thêm tại Điều khoản Sử dụng.