
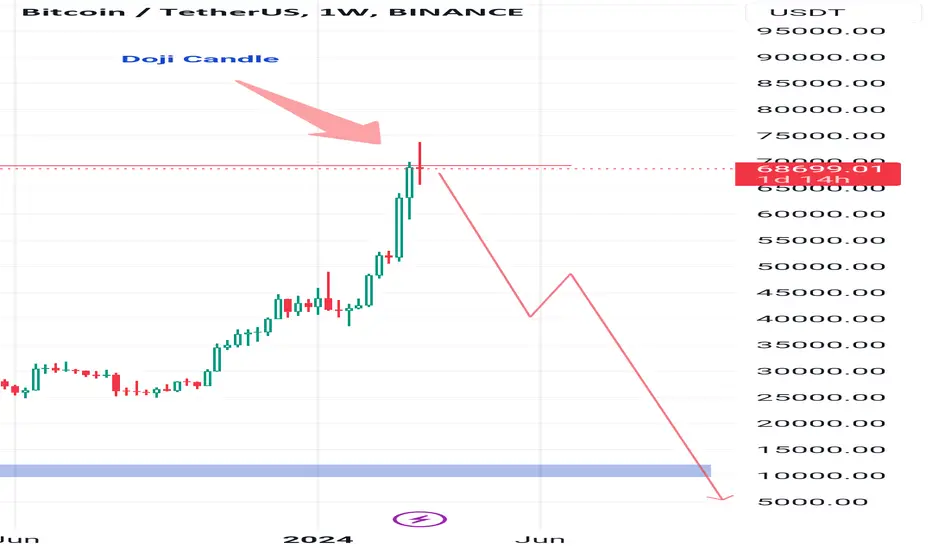
Supply Zone:
A supply zone occurs when the supply of a cryptocurrency exceeds the demand.
In this area, there is excess supply, leading to a falling price.
On a price chart, a supply zone is associated with a downtrend.
Traders often place sell orders in supply zones, expecting prices to decline further.
Imp : forming doji candles in weekly chart
Interpreting Doji Patterns:
Bearish Doji: When a Doji forms at a resistance area, it can signal indecision or a potential trend reversal.
However, the context matters:
If the preceding trend is upward, a bearish Doji may indicate a reversal.
If the preceding trend is downward, it could reinforce the existing bearish sentiment.
A supply zone occurs when the supply of a cryptocurrency exceeds the demand.
In this area, there is excess supply, leading to a falling price.
On a price chart, a supply zone is associated with a downtrend.
Traders often place sell orders in supply zones, expecting prices to decline further.
Imp : forming doji candles in weekly chart
Interpreting Doji Patterns:
Bearish Doji: When a Doji forms at a resistance area, it can signal indecision or a potential trend reversal.
However, the context matters:
If the preceding trend is upward, a bearish Doji may indicate a reversal.
If the preceding trend is downward, it could reinforce the existing bearish sentiment.

Thông báo miễn trừ trách nhiệm
Thông tin và các ấn phẩm này không nhằm mục đích, và không cấu thành, lời khuyên hoặc khuyến nghị về tài chính, đầu tư, giao dịch hay các loại khác do TradingView cung cấp hoặc xác nhận. Đọc thêm tại Điều khoản Sử dụng.
Thông báo miễn trừ trách nhiệm
Thông tin và các ấn phẩm này không nhằm mục đích, và không cấu thành, lời khuyên hoặc khuyến nghị về tài chính, đầu tư, giao dịch hay các loại khác do TradingView cung cấp hoặc xác nhận. Đọc thêm tại Điều khoản Sử dụng.