
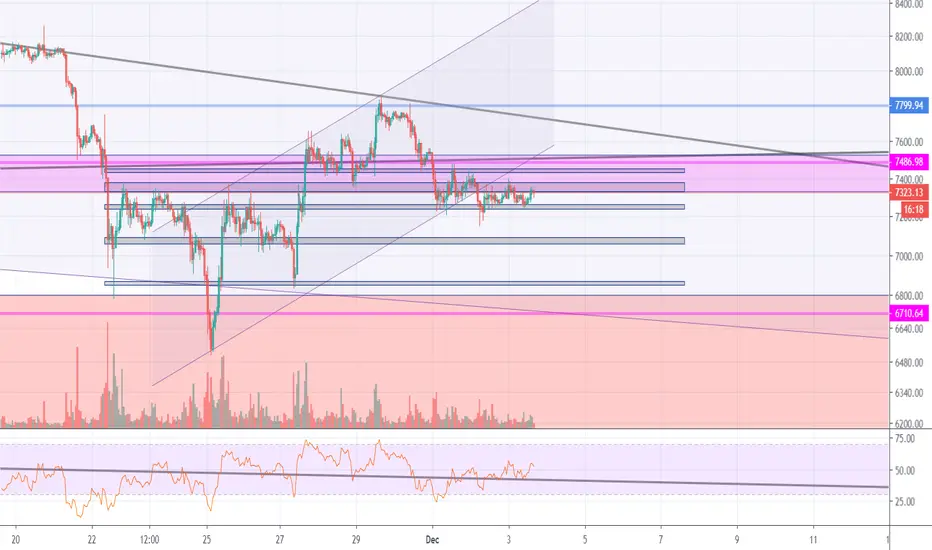
Hey, everybody, I'm the developer of an artificial intelligence buy-sell robot called Mikabot. In the light of the information provided by the new "Channel Bender" module, I added dark horizontal areas to the chart.
You see the dark horizontal areas in the graph.
These areas work as a trend and are the resistance and support of the channels.
The price of Bitcoin will probably find the new direction trapped between these trends.
Let's see what happens.
You see the dark horizontal areas in the graph.
These areas work as a trend and are the resistance and support of the channels.
The price of Bitcoin will probably find the new direction trapped between these trends.
Let's see what happens.

Bài đăng liên quan
Thông báo miễn trừ trách nhiệm
Thông tin và các ấn phẩm này không nhằm mục đích, và không cấu thành, lời khuyên hoặc khuyến nghị về tài chính, đầu tư, giao dịch hay các loại khác do TradingView cung cấp hoặc xác nhận. Đọc thêm tại Điều khoản Sử dụng.
Bài đăng liên quan
Thông báo miễn trừ trách nhiệm
Thông tin và các ấn phẩm này không nhằm mục đích, và không cấu thành, lời khuyên hoặc khuyến nghị về tài chính, đầu tư, giao dịch hay các loại khác do TradingView cung cấp hoặc xác nhận. Đọc thêm tại Điều khoản Sử dụng.