
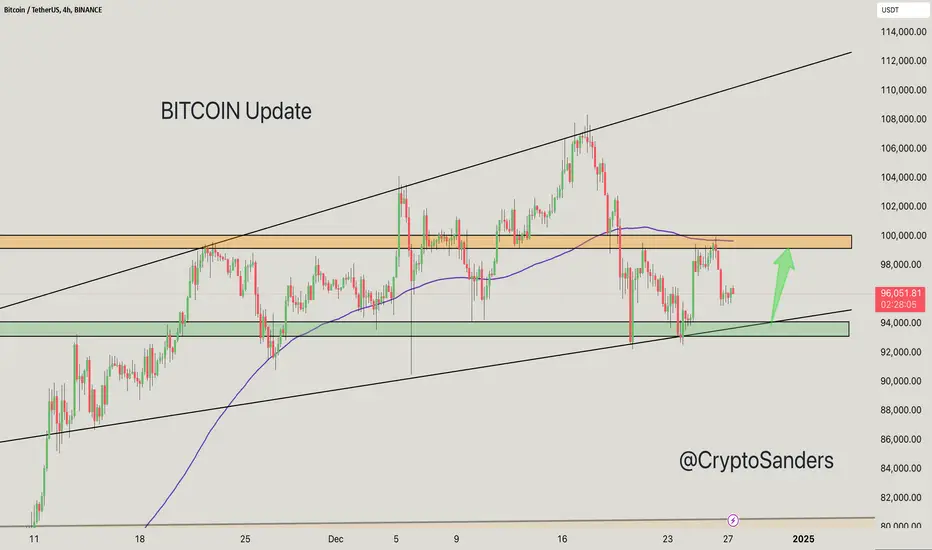
BTC appears to be trading within an ascending channel. The chart shows a bullish medium-term structure.
The price is currently testing the lower trendline support within the channel.
A crucial support area is marked between $94,000 – $92,000 (green area). This is a crucial level for a bounce.
Any break below this support could invalidate the channel and lead to further upward pressure.
Resistance lies around $100,000 – $102,000 (orange area), which has been tested multiple times.
A breakout above this level could spark a bullish push towards the upper trendline of the channel or new highs.
For updates on other coins or personalized insights, feel free to reach out via DM.
@Peter_CSAdmin

Bài đăng liên quan
Thông báo miễn trừ trách nhiệm
Thông tin và các ấn phẩm này không nhằm mục đích, và không cấu thành, lời khuyên hoặc khuyến nghị về tài chính, đầu tư, giao dịch hay các loại khác do TradingView cung cấp hoặc xác nhận. Đọc thêm tại Điều khoản Sử dụng.
Bài đăng liên quan
Thông báo miễn trừ trách nhiệm
Thông tin và các ấn phẩm này không nhằm mục đích, và không cấu thành, lời khuyên hoặc khuyến nghị về tài chính, đầu tư, giao dịch hay các loại khác do TradingView cung cấp hoặc xác nhận. Đọc thêm tại Điều khoản Sử dụng.