
Hello friends
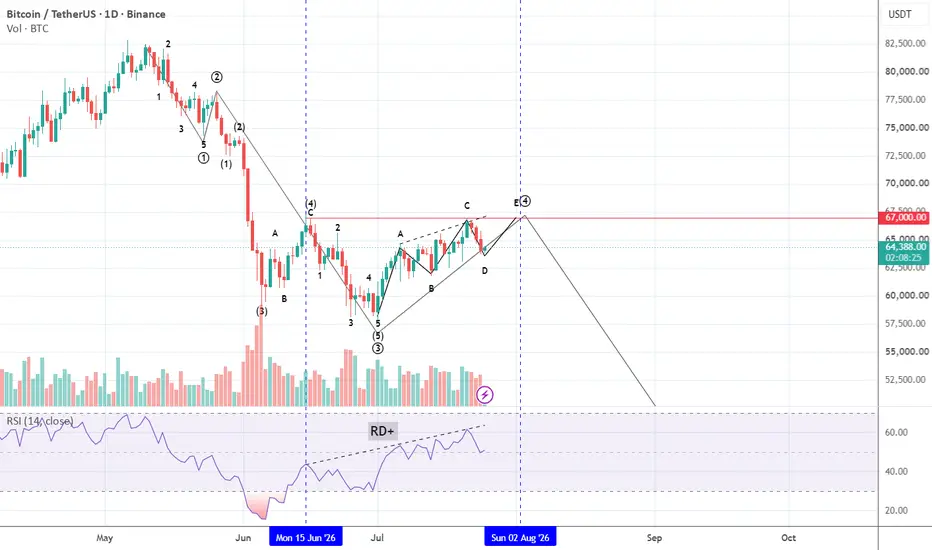
In the Bitcoin chart, we see a triangle forming in the dominant wave 4 of C. Triangles are usually seen in waves 4 and B.
So our guess is probably right.
There will always be a divergence between waves 3 and 5 and we expect this divergence.
The triangles are in the form of 3-3-3-3-3 and we are currently at the beginning of wave E
Now our trading setup involves breaking the uptrend line at the bottom of the triangle and pulling back to it. The price target will be $50,000 and then $42,000, depending on the supports and Fibonacci.
Be successful and profitable.
In the Bitcoin chart, we see a triangle forming in the dominant wave 4 of C. Triangles are usually seen in waves 4 and B.
So our guess is probably right.
There will always be a divergence between waves 3 and 5 and we expect this divergence.
The triangles are in the form of 3-3-3-3-3 and we are currently at the beginning of wave E
Now our trading setup involves breaking the uptrend line at the bottom of the triangle and pulling back to it. The price target will be $50,000 and then $42,000, depending on the supports and Fibonacci.
Be successful and profitable.

Thông báo miễn trừ trách nhiệm
Thông tin và các ấn phẩm này không nhằm mục đích, và không cấu thành, lời khuyên hoặc khuyến nghị về tài chính, đầu tư, giao dịch hay các loại khác do TradingView cung cấp hoặc xác nhận. Đọc thêm tại Điều khoản Sử dụng.
Thông báo miễn trừ trách nhiệm
Thông tin và các ấn phẩm này không nhằm mục đích, và không cấu thành, lời khuyên hoặc khuyến nghị về tài chính, đầu tư, giao dịch hay các loại khác do TradingView cung cấp hoặc xác nhận. Đọc thêm tại Điều khoản Sử dụng.